




A candlestick is a chart element that displays four key pieces of price information for a defined time period: the opening price, the closing price, the highest price reached, and the lowest price reached. Candlestick charts are the most widely used chart type in binary options trading because they show more information than a line chart while remaining visually straightforward to read.
The Four Prices a Candlestick Shows
Every candlestick — regardless of its size, colour, or shape — contains exactly four pieces of information:
Open: The price of the asset at the very start of the candle’s period. This is where price was when the candle began.
Close: The price of the asset at the very end of the candle’s period. This is where price settled when the candle finished.
High: The highest price the asset reached at any point during the candle’s period — even if only momentarily.
Low: The lowest price the asset reached at any point during the candle’s period.
These four prices together tell you the complete story of what happened during that time period: where price started, where it ended, and how far it travelled in each direction along the way.
Anatomy of a Candlestick — Every Part Explained
A candlestick has two visual components:
The Body
The rectangular section of the candle that connects the opening price to the closing price.
- Tall body: Price moved significantly between open and close — buyers or sellers were strongly in control throughout the period
- Short body: Price moved little between open and close — neither buyers nor sellers dominated decisively
- No visible body (Doji): Open and close are equal or nearly equal — complete balance between buyers and sellers
The Wicks (also called Shadows or Tails)
The thin lines extending above and below the body.
Upper wick: Extends from the top of the body to the High. It shows how high price went during the period before falling back to the close.
Lower wick: Extends from the bottom of the body to the Low. It shows how low price went during the period before recovering to the close.
Long wick: Price moved far in that direction during the candle but did not sustain it — the opposing side pushed back
Short wick or no wick: Price moved cleanly in one direction with little opposition in that area
Full Anatomy Reference
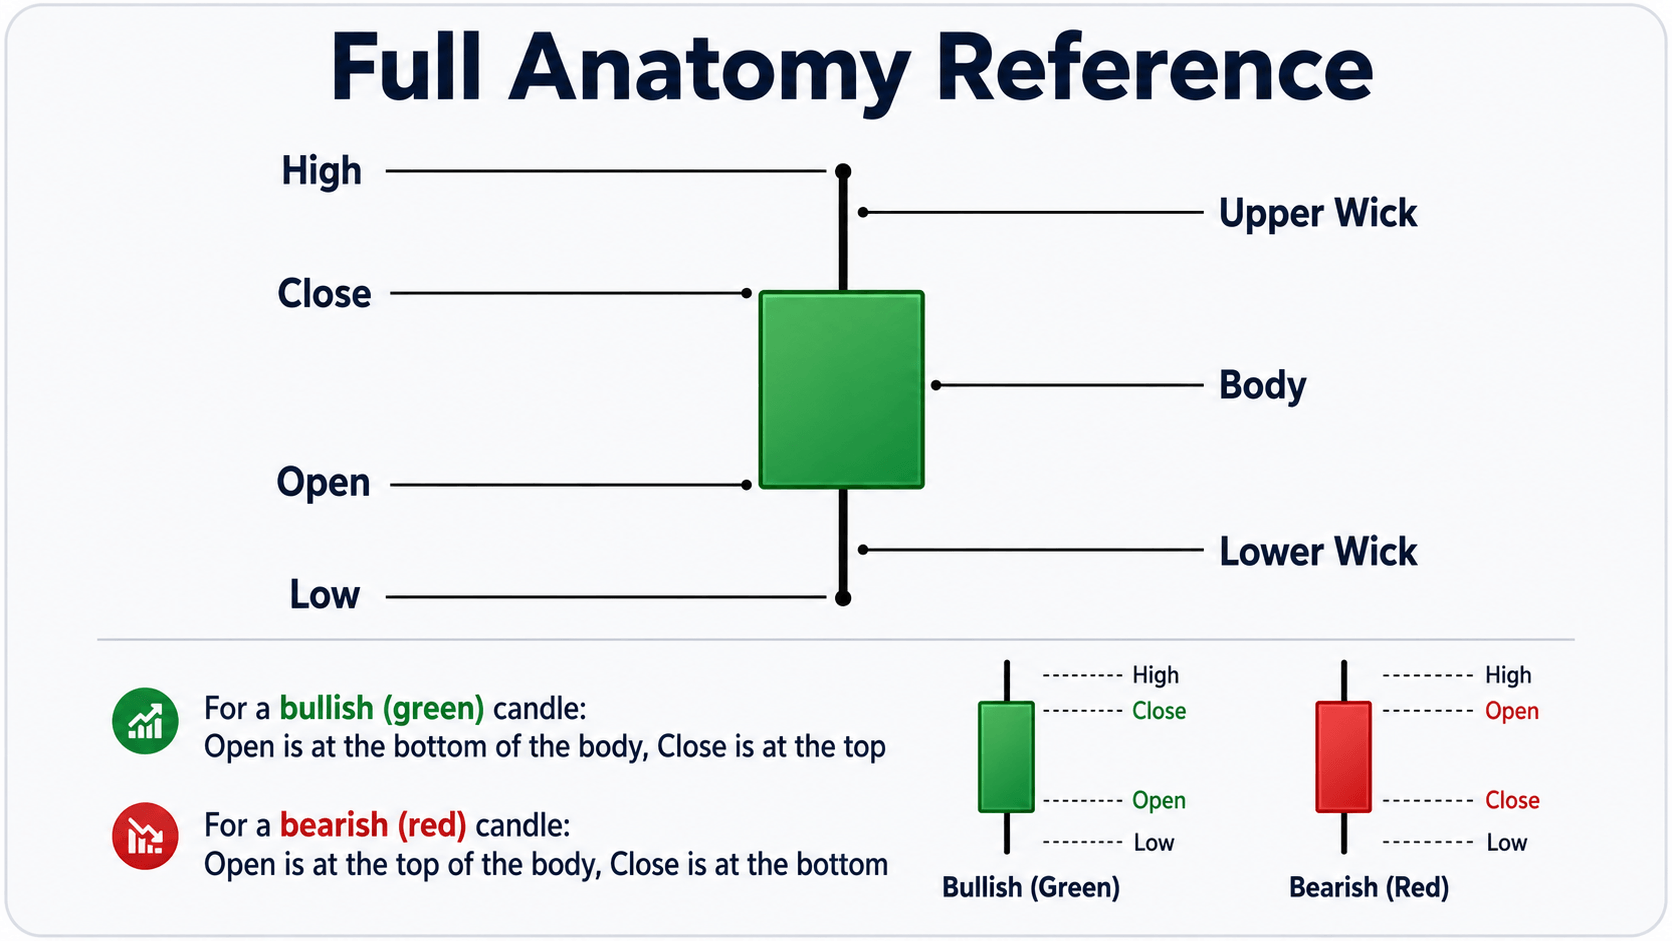
For a bullish (green) candle: Open is at the bottom of the body, Close is at the top
For a bearish (red) candle: Open is at the top of the body, Close is at the bottom
Bullish vs Bearish Candlesticks
The colour of a candlestick tells you whether price rose or fell during that period:
Bullish Candlestick (Green or White)
Price closed higher than it opened.
- Open is at the bottom of the body
- Close is at the top of the body
- Buyers were in control — more buying pressure than selling during this period
Bearish Candlestick (Red or Black)
Price closed lower than it opened.
- Open is at the top of the body
- Close is at the bottom of the body
- Sellers were in control — more selling pressure than buying during this period
Important: The colour shows the relationship between open and close — not the direction price moved overall. A green candle can have a lower close than the previous candle’s close. Colour tells you about the specific period, not the broader trend.
What Candlestick Size and Shape Tell You
The shape of a candlestick communicates the balance of power between buyers and sellers during that period. Learning to read this quickly is the foundation of candlestick-based analysis.
Large Body, Small Wicks
What it means: Strong directional control. Buyers (bullish) or sellers (bearish) dominated the entire period with little opposition. Price opened and moved decisively in one direction, closing near the extreme of the candle.
In binary options: A large bullish candle in an uptrend confirms momentum. A large bearish candle against your Call trade direction is a warning — selling pressure is strong.
Small Body, Large Wicks on Both Sides
What it means: Indecision. Price moved significantly in both directions during the period but settled close to where it started. Neither buyers nor sellers achieved lasting control.
In binary options: This formation — particularly a Doji — at a key price level after a sustained trend can signal that the trend is losing momentum.
Small Body, Large Lower Wick, Small Upper Wick
What it means: Sellers pushed price sharply lower during the period, but buyers stepped in and drove price back up to close near the top of the candle. The lower wick represents the sellers’ attempt — the small body near the top represents the buyers’ recovery.
In binary options: This is a Pin Bar or Hammer — one of the most significant reversal signals at a support level.
Small Body, Large Upper Wick, Small Lower Wick
What it means: Buyers pushed price sharply higher during the period, but sellers drove it back down before the close. The upper wick shows the buyers’ failed attempt.
In binary options: A Bearish Pin Bar or Shooting Star at a resistance level — potential signal for a Put trade.
Large Body, No Wicks (or Very Small Wicks)
What it means: Complete one-sided control. Price opened and moved directly to the close with almost no opposition in either direction.
In binary options: The strongest momentum signal — trend is strong and sustained. Trading against this type of candle requires very strong justification.
Top Broker Picks for 2026
Three platforms that ranked highest in our real-account testing this year.


How Candlesticks Connect to Binary Options Decisions
In binary options, you are predicting price direction over a defined period. Candlesticks are your primary visual tool for assessing what buyers and sellers are doing right now — which is the foundation of that prediction.
Three ways candlesticks inform binary options decisions:
1. Identifying Entry Signals
Specific candlestick formations — pin bars, engulfing patterns, hammers, doji — at key price levels provide the clearest basis for placing a Call or Put. A bullish pin bar at support is a concrete reason to place a Call. A bearish engulfing at resistance is a concrete reason to place a Put.
Without candlestick reading, entries are based on vague impressions rather than specific price behaviour.
2. Confirming Indicator Signals
When an RSI signal (recovering from oversold) coincides with a bullish candlestick pattern (hammer) at a support level — the three signals together are more meaningful than any one alone. Candlesticks provide the price action confirmation that indicator signals alone cannot.
3. Reading Trend Strength
A series of large bullish candles with small wicks — each closing near its high — shows a strong uptrend. This context tells you that Calls aligned with the trend are in a favourable momentum environment. A series of mixed, indecisive candles tells you the market is uncertain — a lower-quality environment for directional trades.
Candlestick Timeframes
The same four-price structure applies to candlesticks on every timeframe — but what each candle represents changes completely:
| Timeframe | Each Candle Shows | What You See |
|---|---|---|
| 1 minute | 1 minute of price action | Many candles, high noise, rapid changes |
| 5 minutes | 5 minutes of price action | Still noisy, patterns less reliable |
| 15 minutes | 15 minutes of price action | Moderate detail, better signal quality |
| 30 minutes | 30 minutes of price action | Good balance of detail and clarity |
| 1 hour | 1 hour of price action | Clear trends, reliable pattern signals |
| 4 hours | 4 hours of price action | Major levels and trend structure |
| Daily | One full trading day | Long-term trend context |
Key principle: The higher the timeframe, the more participants contributed to forming that candle — and therefore the more weight its shape and pattern carry.
A pin bar on a daily chart represents an entire day of trading activity, with thousands of participants collectively rejecting a price level. A pin bar on a 1-minute chart represents 60 seconds of activity — driven largely by random tick movement.
For binary options beginners: Start reading candlesticks on the 15-minute or 30-minute chart. This timeframe provides enough candles to identify patterns clearly while filtering out most of the random noise present on shorter timeframes.
See our full definition: Timeframe →
Reading Multiple Candles Together
Individual candlesticks tell you about one period. Multiple candles together tell you about the developing story between buyers and sellers — which is more valuable than any single candle in isolation.
Series of Bullish Candles (Uptrend)
Each candle opens near the close of the previous one and closes higher. The series creates a staircase pattern — the defining visual of an uptrend. Each new candle confirms that buying pressure is sustained.
Series of Bearish Candles (Downtrend)
Each candle opens near the previous close and closes lower. The mirror of an uptrend — sustained selling pressure.
Alternating Candles (Range / Indecision)
No consistent direction. Bullish and bearish candles alternate or are similar in size. Neither buyers nor sellers are sustaining control. This is a ranging market — trend-following strategies produce more false signals in this environment.
Large Candle Followed by Small Candles (Momentum Fading)
A series of large directional candles gradually gives way to smaller candles. Momentum is decelerating. This does not guarantee a reversal — but it warns that the move’s energy is diminishing.
Two-Candle Patterns
Some of the most reliable candlestick signals involve two consecutive candles working together:
- Bullish Engulfing: Small bearish candle followed by large bullish candle that fully covers it — decisive momentum shift to buyers. See Engulfing Guide →
- Bearish Engulfing: Small bullish candle followed by large bearish candle — decisive shift to sellers
- Inside Bar: Second candle contained entirely within the first — consolidation before a breakout. See Inside Bar Guide →
Common Mistakes When Reading Candlesticks
Mistake 1: Trading patterns without location context
A bullish pin bar means nothing in open space with no support nearby. A bearish engulfing means nothing without a resistance level to give it context. Always identify your key support and resistance levels first — then look for candlestick signals at those levels.
Mistake 2: Interpreting a candle before it closes
A candle that looks like a bullish pin bar mid-session may close as an indecisive doji or even a bearish candle. The shape of a candle is only meaningful at the moment it closes. Never make a trading decision based on a candle that is still forming.
Mistake 3: Treating every coloured candle as a signal
Not every green candle is a reason to place a Call. Not every red candle is a reason to place a Put. Individual candles provide context — only specific formations at specific price levels provide signals.
Mistake 4: Using only the candle colour and ignoring the wicks
A green candle with a large upper wick tells a very different story from a green candle with no wicks. The wick shows where price went and was rejected — often more informative than the body colour alone.
Mistake 5: Reading candlesticks on too short a timeframe
On 1-minute and 5-minute charts, individual candles are heavily influenced by random tick movement. The patterns that appear on these timeframes are less reliable than the same patterns on 15-minute or 1-hour charts. Start with higher timeframes and work downward as your experience develops.
FAQ
What is a candlestick in binary options?
A candlestick is a chart element that displays four prices for a defined time period: the open (starting price), close (ending price), high (highest point reached), and low (lowest point reached). The body connects open and close; the wicks show the high and low extremes. Candlestick charts are the standard chart type used for technical analysis in binary options trading.
What does a green candlestick mean?
A green (or white) candlestick means price closed higher than it opened during that period — buyers were in control. The open is at the bottom of the body, the close is at the top. A green candle does not necessarily mean price is higher than the previous candle’s close — it only shows the relationship between that candle’s own open and close.
What does a red candlestick mean?
A red (or black) candlestick means price closed lower than it opened — sellers were in control during that period. The open is at the top of the body, the close is at the bottom.
What are the wicks on a candlestick?
Wicks (also called shadows or tails) are the thin lines extending above and below the body of the candlestick. The upper wick shows how high price went during the period before falling back. The lower wick shows how low price went before recovering. Long wicks indicate that price moved significantly in that direction but was rejected — the opposing side pushed back before the close.
Which candlestick chart is best for binary options?
The 15-minute and 30-minute timeframes are the most practical starting point for most binary options traders. They provide enough candles to identify trends and patterns clearly, while filtering out most of the random noise present on 1-minute and 5-minute charts. The expiry time should then be matched to the analysis timeframe.
What is the difference between a candlestick and a bar chart?
Both display the same four prices (open, high, low, close). A bar chart shows these as a vertical line with small horizontal ticks for open and close. A candlestick shows the same information with a filled body between open and close — making the relationship between open and close visually immediate and the body size instantly readable. Most traders find candlestick charts easier to read at a glance.
Do I need to know all candlestick patterns?
No. A small number of patterns — pin bar, doji, engulfing, hammer, inside bar — cover the most commonly traded and analytically relevant formations. Learning these thoroughly and applying them consistently at key price levels is more valuable than knowing every named pattern in existence.
Related Terms
→ Call Option | Put Option | Support and Resistance | Timeframe | Indicator | Volatility
You Might Also Like

What Is Momentum in Trading?
Momentum is the rate at which price is moving in a given direction — how fast and with how much...

What Is Divergence in Trading?
Divergence occurs when the direction of a momentum indicator disagrees with the direction of price. Price makes a new high,...

What Is a Call Option? Full Guide
A Call option is a prediction that the price of an asset will be higher at the moment of expiry...