Divergence occurs when a momentum indicator and price move in opposite directions. Learn bullish and bearish divergence, how to identify it on RSI and MACD, and how to use it for entries.
Maria R.
•30 июля 2026
Divergence occurs when the direction of a momentum indicator disagrees with the direction of price. Price makes a new high, but the indicator makes a lower high — or price makes a new low, but the indicator makes a higher low. This disagreement signals that the momentum driving the current price move is weakening — and that a reversal may be approaching.
Why Divergence Matters
Price and momentum normally move together. When price makes a new high, the indicators measuring momentum also make a new high — buyers are driving price upward with sustained energy. When price makes a new low, momentum confirms by also making a new low — sellers are pressing with continued force.
Divergence is the exception. It occurs when price and momentum disagree — price continues in one direction, but the underlying momentum tells a different story. This disagreement is significant because:
Momentum leads price. Momentum begins to weaken before price actually reverses. By the time price has turned, the divergence has already been visible on the indicator for some time. Spotting divergence early gives you advance warning of a potential reversal — before it appears in the price chart itself.
It is observable and measurable. Unlike some trading concepts that rely on subjective interpretation, divergence has a specific definition: compare the peaks or troughs of price to the corresponding peaks or troughs of the indicator. Either they agree or they do not.
It works across asset classes and timeframes. Divergence on EUR/USD, Gold, or an index — on a 15-minute chart or a 1-hour chart — follows the same principle. The concept is universal.
Bullish Divergence — Definition and Example
Bullish divergence is a potential reversal signal that appears during a downtrend or significant price decline. It suggests that selling momentum is weakening even though price is still falling — and that a bullish reversal may be approaching.
Definition
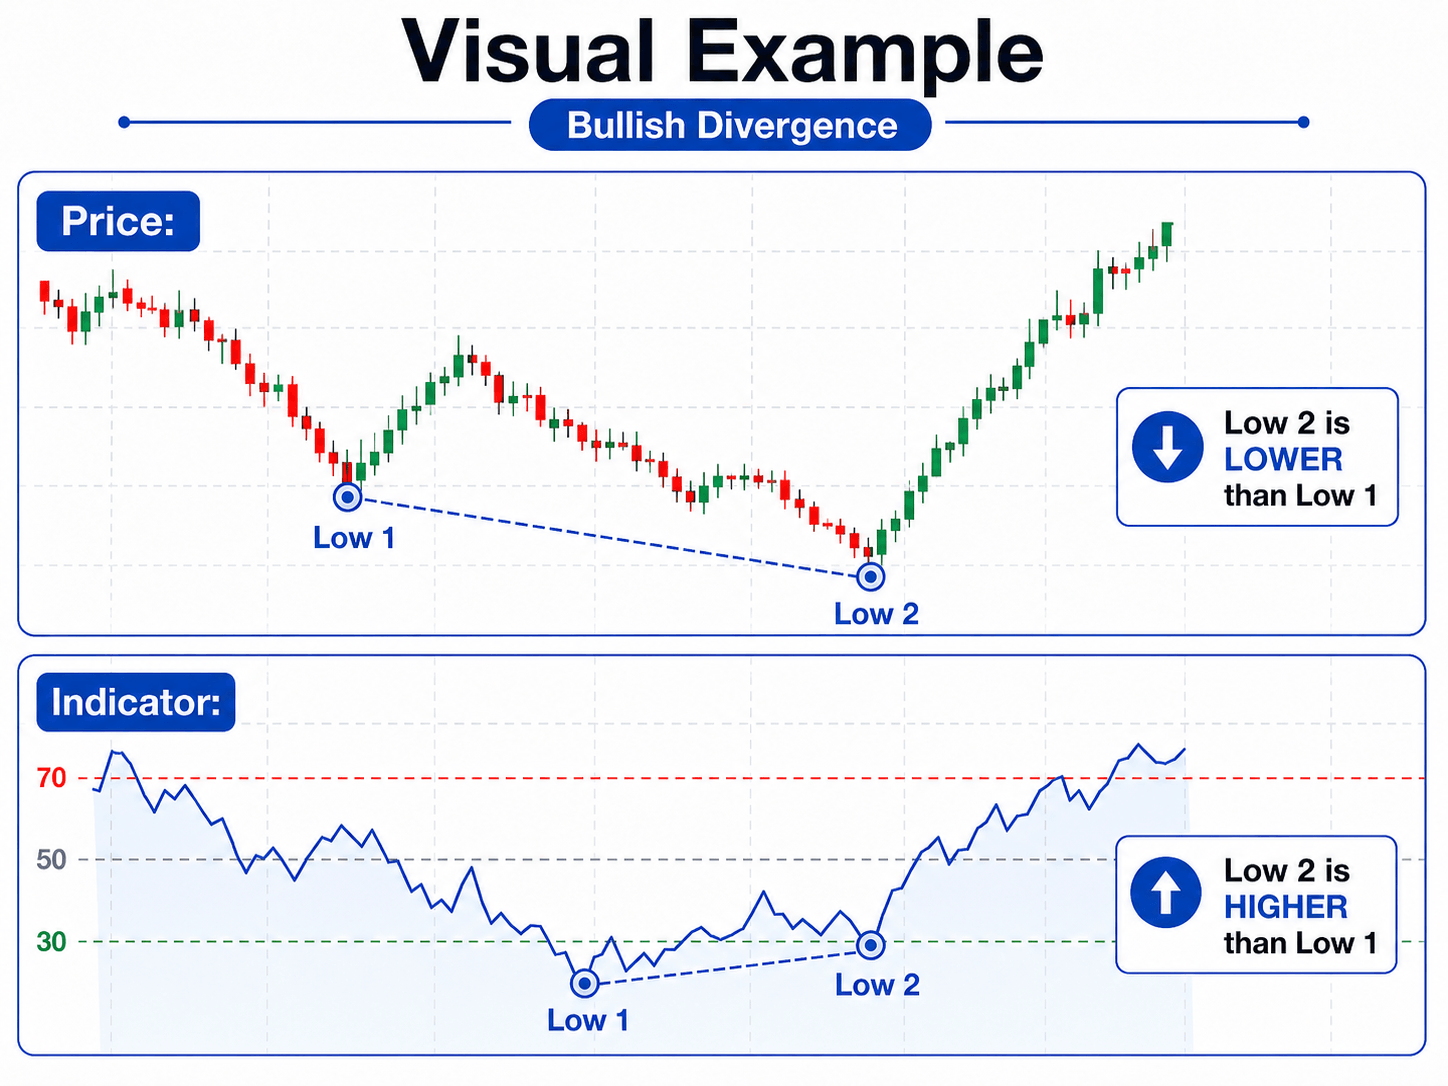
Price: Makes a new lower low — the most recent trough is below the previous trough. Price is still declining.
Indicator: Makes a higher low at the same time — the most recent trough on the indicator is above the previous trough. The indicator is rising even as price falls.
This disagreement — price lower, indicator higher — is bullish divergence.
What It Means
Sellers are pushing price to new lows, but they are doing so with less force than before. The momentum behind the downward move is declining. Fewer sellers are participating in each successive low — the selling pressure is exhausting itself.
Visual Example
Price and indicator are moving in opposite directions at the lows — this is the divergence.
In Binary Options
Bullish divergence at a key support level is a potential basis for a Call. The support level shows where buyers have previously stepped in. The divergence shows that the current selling momentum is weakening. A bullish candlestick confirmation — pin bar, hammer, or bullish engulfing at the level — completes the analytical case.
Bearish Divergence — Definition and Example
Bearish divergence is the mirror of bullish divergence. It appears during an uptrend or significant price rise and suggests that buying momentum is weakening — a bearish reversal may be approaching.
Definition
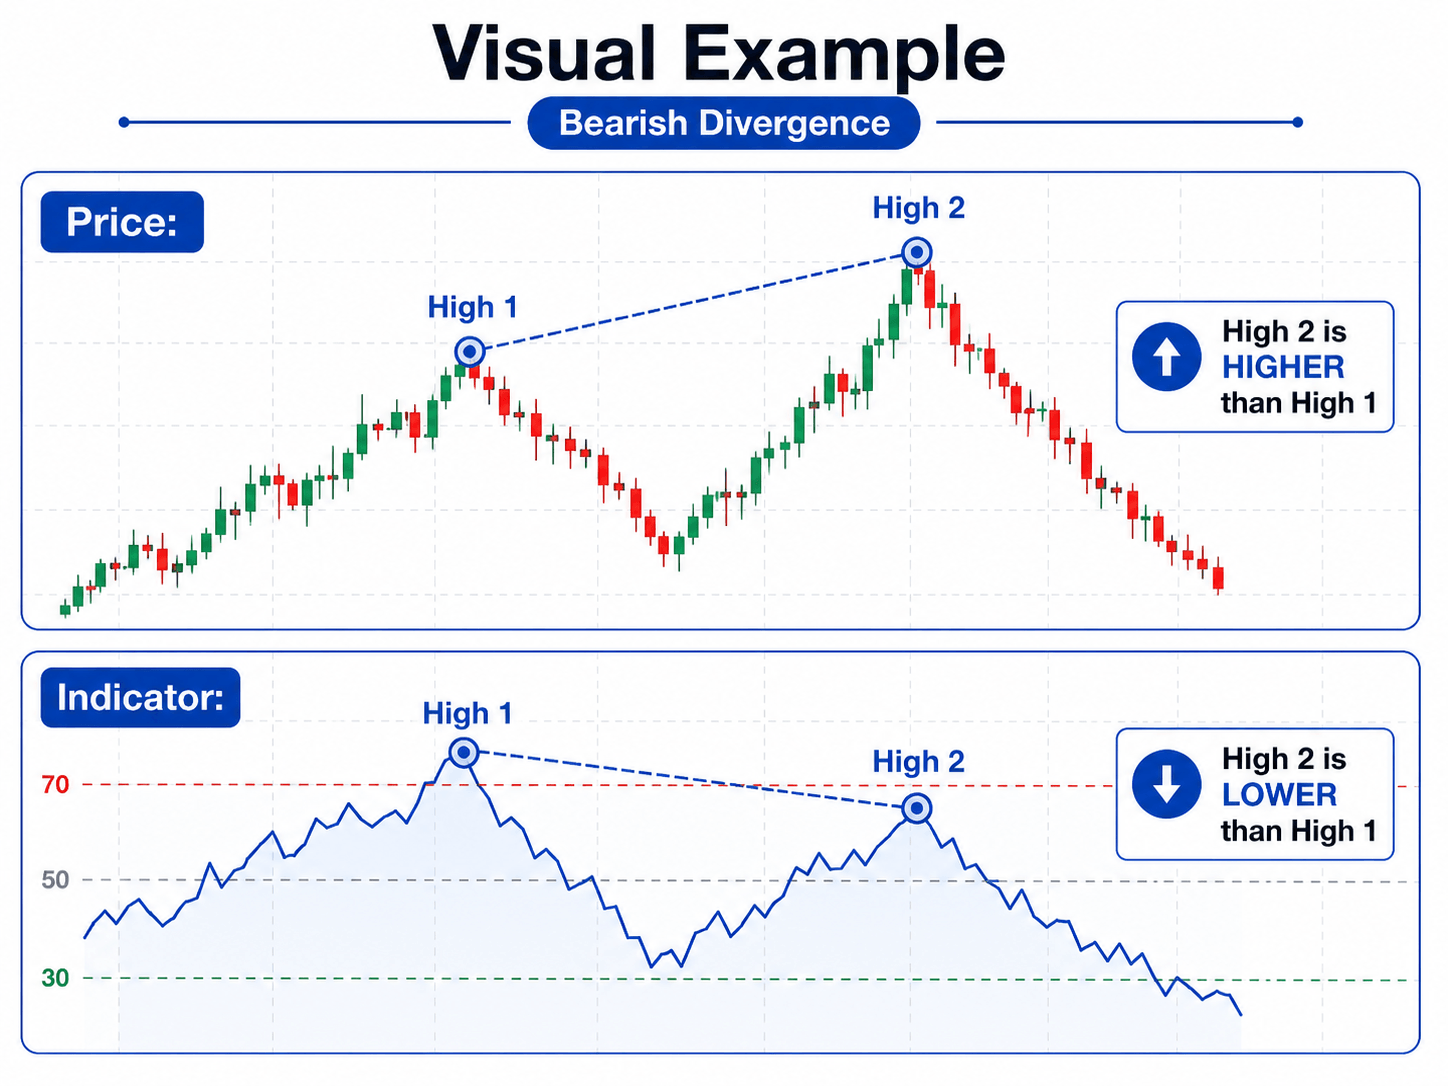
Price: Makes a new higher high — the most recent peak is above the previous peak. Price is still rising.
Indicator: Makes a lower high at the same time — the most recent peak on the indicator is below the previous peak. The indicator is falling even as price rises.
What It Means
Buyers are pushing price to new highs, but with less energy than before. Buying pressure is declining with each successive high. The upward move is losing the momentum that sustained it.
Visual Example
In Binary Options
Bearish divergence at a key resistance level is a potential basis for a Put. Sellers have previously rejected price at this level (resistance). The divergence confirms that buying momentum is weakening as price approaches the same zone. A bearish candlestick — shooting star, bearish pin bar, or bearish engulfing — at the resistance level provides the entry confirmation.
Which Indicators Show Divergence
Divergence is visible on momentum oscillators — indicators that measure the rate of price change rather than the direction of the trend.
RSI (Relative Strength Index)
The most widely used indicator for divergence analysis. RSI measures momentum on a 0–100 scale. Compare RSI peaks to price peaks (bearish divergence) or RSI troughs to price troughs (bullish divergence).
Practical tip: The most reliable RSI divergence involves the oversold zone (below 30) for bullish setups — the divergence forms as RSI is recovering from extreme readings. For bearish setups, look for divergence near or above the overbought zone (above 70).
MACD divergence is typically identified on the histogram — the bars that show the difference between the MACD line and signal line. Compare histogram peaks and troughs to price peaks and troughs.
Practical tip: Use the histogram bars for divergence rather than the MACD lines themselves — the histogram changes direction earlier, providing slightly earlier warning.
Like RSI, the Stochastic is bounded between 0 and 100 and shows overbought/oversold conditions. Divergence on the Stochastic follows the same principle — compare indicator highs/lows to price highs/lows.
Any of these three can show divergence effectively. Many traders use RSI as their primary divergence tool because of its widespread familiarity and clean visual output. The principle is the same regardless of which indicator you choose — pick one and apply it consistently rather than switching between them.
How to Identify Divergence on a Chart — Step by Step
Step 1: Identify a Clear Trend or Sustained Move
Divergence is only meaningful after a sustained price move — an established uptrend for bearish divergence, or a clear downtrend for bullish divergence. Divergence in a ranging, sideways market is less significant.
Step 2: Identify Two Swing Points on Price
For bearish divergence: identify two consecutive swing highs — two local peaks. The second peak should be higher than the first (price is still making higher highs).
For bullish divergence: identify two consecutive swing lows — two local troughs. The second trough should be lower than the first (price is still making lower lows).
Step 3: Check the Corresponding Points on the Indicator
Look at the indicator at exactly the same moments — the points corresponding to your two price peaks or two price troughs.
For bearish divergence: is the indicator lower at the second price peak than at the first? If yes — bearish divergence.
For bullish divergence: is the indicator higher at the second price trough than at the first? If yes — bullish divergence.
Step 4: Draw Trend Lines on Both
Draw a line connecting the two price peaks (or troughs). Draw a corresponding line on the indicator connecting the same two points. If these lines slope in opposite directions — one rising, one falling — divergence is confirmed.
Step 5: Wait for Confirmation
Divergence alone is not an entry signal. Wait for:
A candlestick reversal pattern at a key price level
The indicator crossing a significant level (RSI crossing below 70 for bearish, above 30 for bullish)
A price structure break (price breaking below a recent swing low for bearish divergence confirmation)
Divergence in Binary Options — Practical Application
Call Setup Using Bullish Divergence
Conditions:
Asset is in a downtrend or has made a significant decline
Price makes a new lower low
RSI (or MACD histogram) makes a higher low at the same time — bullish divergence confirmed
The divergence forms at or near a key support level
A bullish candlestick pattern forms (hammer, pin bar, bullish engulfing)
RSI crosses back above 30 (if it was below 30 during the divergence)
Entry: Call at the close of the confirming bullish candle Expiry: Match to your analysis timeframe — 15–60 minutes recommended
Put Setup Using Bearish Divergence
Conditions:
Asset is in an uptrend or has made a significant rally
Price makes a new higher high
RSI (or MACD histogram) makes a lower high — bearish divergence confirmed
The divergence forms at or near a key resistance level
A bearish candlestick pattern forms (shooting star, bearish pin bar, bearish engulfing)
RSI crosses back below 70 (if it was above 70 during the divergence)
Entry: Put at the close of the confirming bearish candle Expiry: Match to analysis timeframe
Why Confluence Is Essential
Divergence on its own has a meaningful false signal rate. Price can continue to make new highs even as the indicator makes lower highs — the divergence persists without producing a reversal. Requiring confluence — a key price level, a candlestick confirmation, and a divergence signal — significantly improves the quality of the setup.
The three-factor requirement means fewer setups qualify — but those that do qualify carry more analytical weight than any single signal alone.
Hidden Divergence — Trend Continuation Signal
Regular divergence signals a potential trend reversal. Hidden divergence signals the opposite — potential trend continuation after a pullback.
Bullish Hidden Divergence (Trend Continuation in Uptrend)
Price: Makes a higher low — pullback does not reach the previous low (trend structure intact)
Indicator: Makes a lower low — indicator dips lower than the previous trough
Signal: The uptrend is likely to continue. The pullback in price was not confirmed by a deeper momentum trough — sellers are not strong enough to sustain the correction.
In binary options: A Call in the direction of the uptrend.
Bearish Hidden Divergence (Trend Continuation in Downtrend)
Price: Makes a lower high — rally does not reach the previous high (downtrend structure intact)
Indicator: Makes a higher high — indicator peaks higher than the previous peak
Signal: The downtrend is likely to continue. The rally in price was not confirmed by stronger momentum — buyers are not strong enough to sustain the recovery.
In binary options: A Put in the direction of the downtrend.
Regular vs Hidden Divergence
Regular Divergence
Hidden Divergence
Signal type
Potential reversal
Potential continuation
Bullish setup
Price: lower low / Indicator: higher low
Price: higher low / Indicator: lower low
Bearish setup
Price: higher high / Indicator: lower high
Price: lower high / Indicator: higher high
Trade direction
Against the current move
With the established trend
Best used
At key support/resistance
During pullbacks within a trend
What Makes Divergence Stronger or Weaker
Not all divergence signals carry equal weight. These factors determine quality:
Timeframe: Divergence on a 1-hour chart is more significant than on a 5-minute chart. Higher timeframes reflect more participant activity and produce more reliable signals.
Location: Divergence at a significant support or resistance level is far more reliable than divergence in open chart space. The price level provides the context that gives divergence its meaning.
Indicator zone: RSI divergence that forms while the indicator is in or near the overbought/oversold zones (above 70 or below 30) is more significant than divergence forming near the centreline (50).
Clarity of the two points: Clear, well-defined swing highs or lows on both price and indicator produce clearer divergence signals. Ambiguous, minor fluctuations that could be interpreted as peaks or troughs either way are weaker signals.
Confirmation candle size: A large, decisive bullish candle confirming a bullish divergence setup is stronger than a small, uncertain candle. The confirmation candle shows that the momentum shift is genuine.
Multiple indicators agreeing: RSI divergence and MACD histogram divergence occurring simultaneously at the same price swing is stronger than either alone.
Common Mistakes
Mistake 1: Treating divergence as an immediate entry signal
Divergence warns that momentum is weakening — it does not tell you exactly when the reversal will occur. Price can continue in the original direction for multiple candles after divergence appears. Always wait for a confirming candlestick pattern or price structure break before entering.
Mistake 2: Drawing divergence lines on minor price fluctuations
The two price points used for divergence should be clear, significant swing highs or lows — not minor tick variations within a candle’s wick. Minor fluctuations produce false divergence signals that do not reflect genuine momentum changes.
Mistake 3: Looking for divergence in ranging markets
Divergence is most meaningful after a sustained directional move. In a sideways market where price oscillates between support and resistance without establishing a clear trend, divergence signals are frequent and unreliable.
Mistake 4: Ignoring the higher timeframe trend
Bullish divergence on a 5-minute chart during a strong daily downtrend is working against significant momentum. The most reliable divergence setups align the divergence signal with a meaningful price level and do not require fighting a dominant higher timeframe trend.
Mistake 5: Connecting the wrong price points
The two peaks or troughs connected for divergence analysis must be genuine swing points — where price clearly reversed direction. Connecting arbitrary points on the chart to create the appearance of divergence produces meaningless signals. If the swing points are not obvious on the raw price chart, the divergence is not clear.
FAQ
What is divergence in binary options?
Divergence occurs when the direction of a momentum indicator (such as RSI or MACD) disagrees with the direction of price. For example: price makes a new higher high but RSI makes a lower high — the indicator is not confirming the price move. This disagreement signals that the momentum behind the current move is weakening, and a reversal may be approaching.
What is the difference between bullish and bearish divergence?
Bullish divergence: price makes a new lower low while the indicator makes a higher low — selling momentum is weakening, potential bullish reversal. Bearish divergence: price makes a new higher high while the indicator makes a lower high — buying momentum is weakening, potential bearish reversal.
Which indicator is best for spotting divergence?
RSI is the most widely used indicator for divergence analysis in binary options because of its clear 0–100 scale and well-defined overbought/oversold zones. MACD histogram divergence is also commonly used and provides slightly earlier signals. Stochastic divergence follows the same principle. Choose one and apply it consistently rather than switching between indicators.
Is divergence reliable as a standalone signal?
No. Divergence has a meaningful false signal rate when used alone. Price can continue making new highs even as the indicator makes lower highs for multiple candles. The most reliable divergence setups require confluence: divergence at a key support or resistance level, confirmed by a candlestick reversal pattern, before a trade is entered.
What is hidden divergence?
Hidden divergence signals trend continuation rather than reversal. Bullish hidden divergence: price makes a higher low (uptrend intact) while the indicator makes a lower low — suggests the uptrend will continue. Bearish hidden divergence: price makes a lower high (downtrend intact) while the indicator makes a higher high — suggests the downtrend will continue. Hidden divergence is used for entering trades in the direction of the established trend during pullbacks.
On which timeframe should I look for divergence?
The 15-minute, 30-minute, and 1-hour charts produce the most reliable divergence signals for binary options trading. Shorter timeframes (1-minute, 5-minute) generate frequent divergence signals that are largely noise. Higher timeframes produce fewer signals but they carry more analytical weight. Start with the 1-hour chart for divergence analysis and use the 15–30 minute chart for entry timing.