




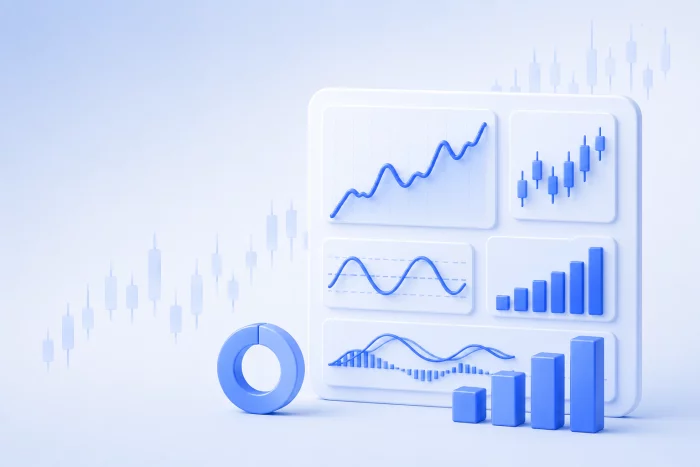
A trading indicator is a mathematical calculation applied to historical price data that produces a visual output on a chart. Indicators help traders identify trend direction, momentum strength, overbought or oversold conditions, and potential entry points — adding an analytical layer beyond reading price alone.
How Indicators Work
Indicators take past price data (close prices, ranges, volume) and apply a formula to produce a line, histogram, or band that represents a specific characteristic of recent price behaviour.
What indicators do:
- Summarise complex price data into a readable format
- Highlight momentum conditions that may not be obvious from the candle chart alone
- Generate signals when specific thresholds are crossed
What indicators cannot do:
- Predict price direction with certainty
- Account for news events or external factors
- Replace analytical judgement
Main Types of Indicators Used in Binary Options
Momentum Oscillators — Measure the speed and magnitude of price movement. Bounded between fixed levels (typically 0–100). Most useful for identifying overbought/oversold conditions and divergence.
Examples: RSI (Relative Strength Index), Stochastic Oscillator
Trend Indicators — Identify the direction and strength of an existing trend. Useful as filters — helping you trade in the direction of the larger move.
Examples: Moving Averages (EMA, SMA), MACD
Volatility Indicators — Measure how much price is expanding or contracting relative to recent history.
Examples: Bollinger Bands
Indicators as Confirmation, Not Prediction
The most common indicator mistake is treating a signal as a prediction. An RSI crossing above 30 does not mean price will rise — it means momentum conditions have shifted from extreme selling to neutral. Combined with a price level (support) and a candlestick signal (bullish pin bar), the indicator adds confirmation to an analytical case.
Use 2–3 indicators maximum. More indicators do not add more information — they add clutter and create conflicting signals that make decision-making harder.
Indicator Guides on TraderRanker
Related Terms
→ Momentum | Overbought | Oversold | Divergence | Volatility
You Might Also Like

What Is Momentum in Trading?
Momentum is the rate at which price is moving in a given direction — how fast and with how much...

What Is Divergence in Trading?
Divergence occurs when the direction of a momentum indicator disagrees with the direction of price. Price makes a new high,...
What Is a Candlestick? Full Guide
A candlestick is a chart element that displays four key pieces of price information for a defined time period: the...