




Trading without a strategy is not trading — it’s gambling. The difference between a trader and a gambler lies precisely in this: the former acts according to a system with clear entry rules, while the latter relies on intuition and luck. In this article, we break down five trading strategies that are ideal for beginners: with clear mechanics, specific rules, and real trade examples.
Important Warning: Trading involves a high risk of capital loss. No strategy guarantees profit. All strategies should be tested on a demo account before applying them with real money.
Table of Contents
- What Makes a Strategy Suitable for Beginners
- Strategy 1: Trend Following
- Strategy 2: Support and Resistance Levels
- Strategy 3: RSI Trading (Overbought / Oversold)
- Strategy 4: Pin Bar (Price Action)
- Strategy 5: News Trading
- How to Choose a Strategy for Your Trading Style
- Common Beginner Mistakes When Applying Strategies
- FAQ
What Makes a Trading Strategy Suitable for Beginners
Before diving into specific trading strategies, it’s important to understand the criteria by which they were selected. Not every working strategy is suitable for a beginner trader — some require years of experience reading the market or complex technical setups that can overwhelm someone just starting out.
A good trading strategy for beginners meets several requirements simultaneously.
First, the entry rules must be unambiguous: a signal either exists or it doesn’t — without a broad zone of subjective interpretation. Clear, binary signals reduce decision fatigue and help beginners build confidence in their system.
Second, the strategy should be based on widely available tools found on any trading platform: basic indicators, candlestick patterns, and price levels. There should be no need for expensive proprietary software or paid signal services.
Third, it should generate a sufficient number of signals during a trading session — not once a week, but also not every 30 seconds, which leads to emotional overload and impulsive decision-making.
Fourth, the strategy’s results should be verifiable on historical data (backtesting), allowing the beginner to independently evaluate its statistics before trading with real money.
All five strategies in this guide meet these criteria. They are used by professional traders in various modifications, but are described here in a simplified form — without excessive filters and additional conditions that beginners find difficult to monitor simultaneously.
Strategy 1: Trend Following
| Difficulty Level | Low |
| Timeframe | M15, M30, H1 |
| Recommended Assets | Currency pairs (EUR/USD, GBP/USD), indices |
| Trade Duration | 15–60 minutes |
Strategy Overview
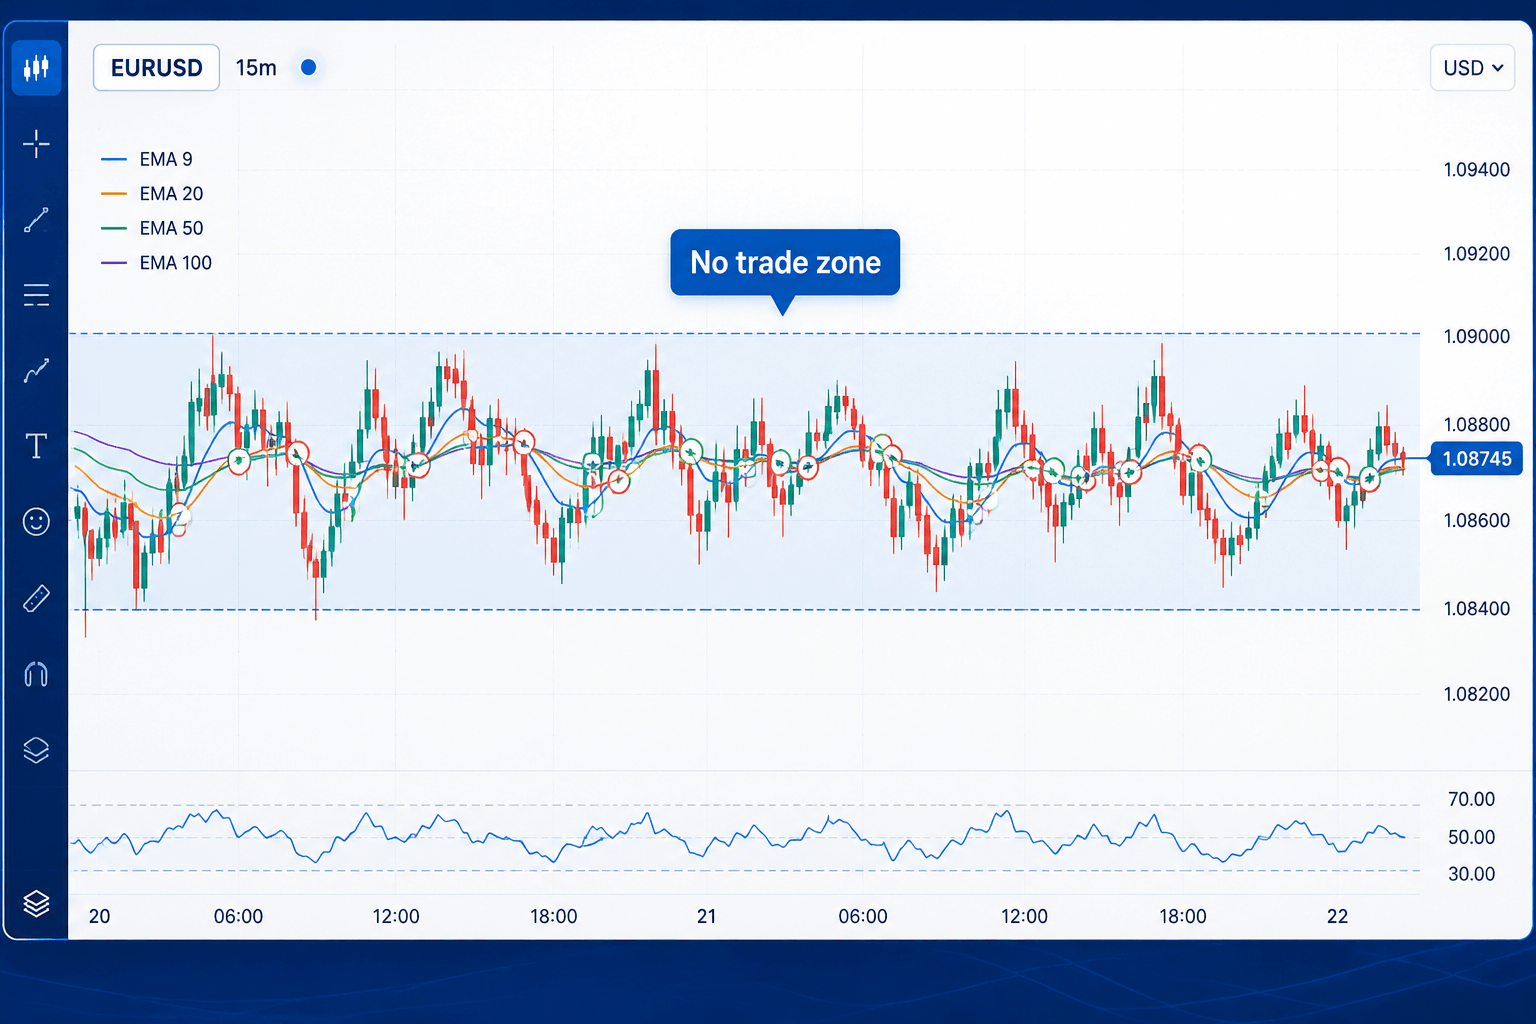
A trend is a sustained directional price movement in one direction. The trend following strategy is built on simple logic: if the market is moving up, there is a high probability that the next candle will also close higher. Trading with the trend is considered one of the most reliable approaches in short-term trading because the trader acts in the direction of momentum, not against it. This is why «the trend is your friend» remains one of the most cited principles in trading education.
To identify the trend, two moving averages are used: a fast EMA with a period of 9 and a slow EMA with a period of 21. When the fast moving average is above the slow one, the market is in an uptrend, and only buy (long) positions are opened. When the fast EMA is below the slow one, the market is in a downtrend, and only sell (short) positions are considered.
Entry Rules
Buy signal (CALL / Long) is formed when three conditions are met simultaneously: the fast EMA(9) is positioned above the slow EMA(21), the price is above both moving averages, and the last closed candle is bullish (close above open).
Sell signal (PUT / Short) is the mirror image: EMA(9) below EMA(21), price below both lines, and the last candle is bearish.
An additional filter that improves signal quality: the angle of inclination of the moving averages. The steeper the angle, the stronger the trend and the more reliable the signal. If the moving averages are practically horizontal, it’s better to refrain from entering — the market is likely in a consolidation phase.
When This Strategy Doesn’t Work
The trend following strategy loses effectiveness in a sideways market (consolidation or «chop»), when the price moves in a narrow horizontal range. During such periods, the moving averages constantly cross each other, producing false signals. Before applying this strategy, always assess the overall context: is there a clear directional movement in the market? If the EMAs are flat and intertwined, wait for a new trend to develop before taking trades.
Strategy 2: Support and Resistance Levels
| Difficulty Level | Medium |
| Timeframe | M15, M30, H1 |
| Recommended Assets | Any — currencies, stocks, gold, oil |
| Trade Duration | 15–30 minutes |
Strategy Overview
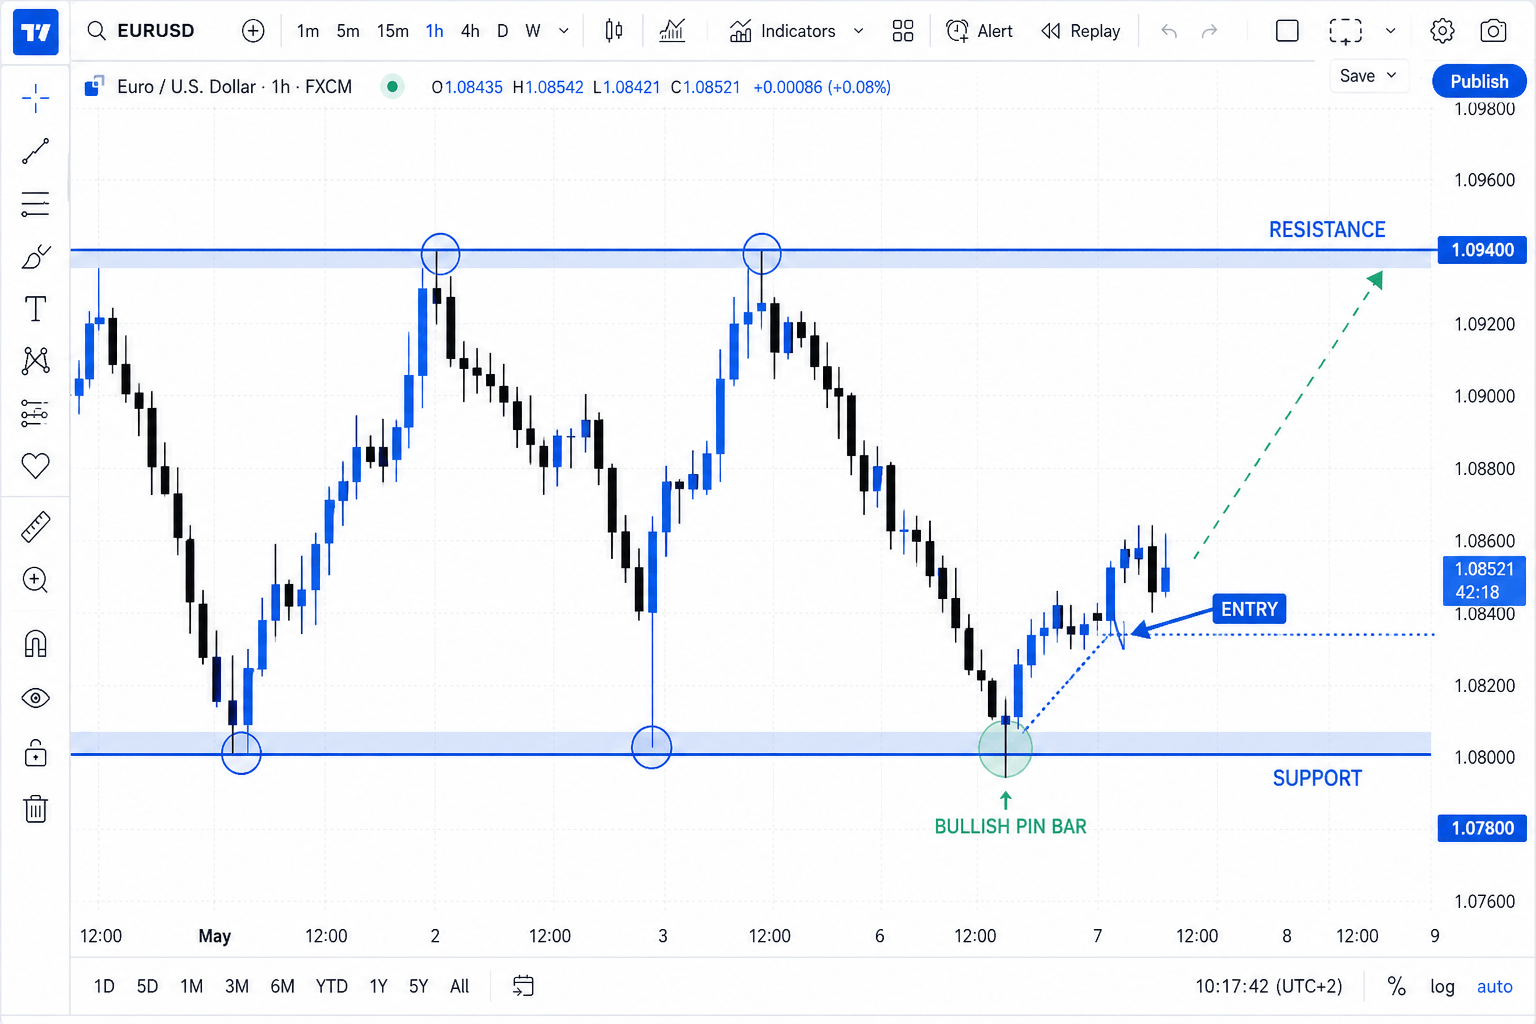
Support and resistance levels are one of the fundamental tools of technical analysis and form the backbone of countless trading strategies used by professionals worldwide. A support level is a horizontal zone from which the price has historically bounced upward. A resistance level is a zone from which the price has historically reversed downward. The strategy’s logic is straightforward: the more times the price has tested a level without breaking through it, the higher the probability of a bounce at the next touch.
This trading strategy is particularly effective in a sideways market — precisely where the trend following strategy struggles. Thus, Strategies 1 and 2 complement each other well, and together they cover most market conditions a beginner will encounter.
How to Draw Levels
Levels are drawn on a higher timeframe than the one used for trading. If you trade on M15, draw your levels on H1 or H4. Key levels include local minimums and maximums from the past several weeks, as well as round numbers (1.0800, 1.0850, 1.0900 for EUR/USD), which attract a large number of orders and act as magnets for price. Round numbers hold psychological significance for traders and institutions alike, making them particularly reliable support and resistance zones.
Entry Rules
Buy signal (CALL / Long): the price has approached a support level, a reversal candlestick pattern has formed (pin bar, doji, engulfing) directly on the level or in its immediate vicinity, and volume at the moment of the level touch is noticeably above average — this confirms buyer interest and validates the support zone.
Sell signal (PUT / Short): the price has approached a resistance level, and a bearish reversal candle has formed, indicating that sellers are defending the level.
Trade Example
Gold (XAU/USD) on M30. On the H1 chart, a clear support zone is visible in the 2280–2285 dollar area, which has already held the price from falling three times over the past two weeks. The price approaches this zone again. On the last candle, a doji (cross) forms — a signal of indecision and potential reversal. We open a buy position with a 30-minute time horizon.
Important Nuance
Levels are zones, not exact lines. Price rarely reverses with pinpoint precision: it may slightly «pierce» the level before reversing — this is known as a false breakout or «liquidity grab.» If the price confidently closes beyond the level with strong momentum, this is a genuine breakout, not a false pierce. In the case of a confirmed breakout, the reversal signal loses its validity.
Strategy 3: RSI Trading (Overbought / Oversold)
| Difficulty Level | Low |
| Timeframe | M5, M15, M30 |
| Recommended Assets | Highly liquid currency pairs |
| Trade Duration | 5–15 minutes |
Strategy Overview
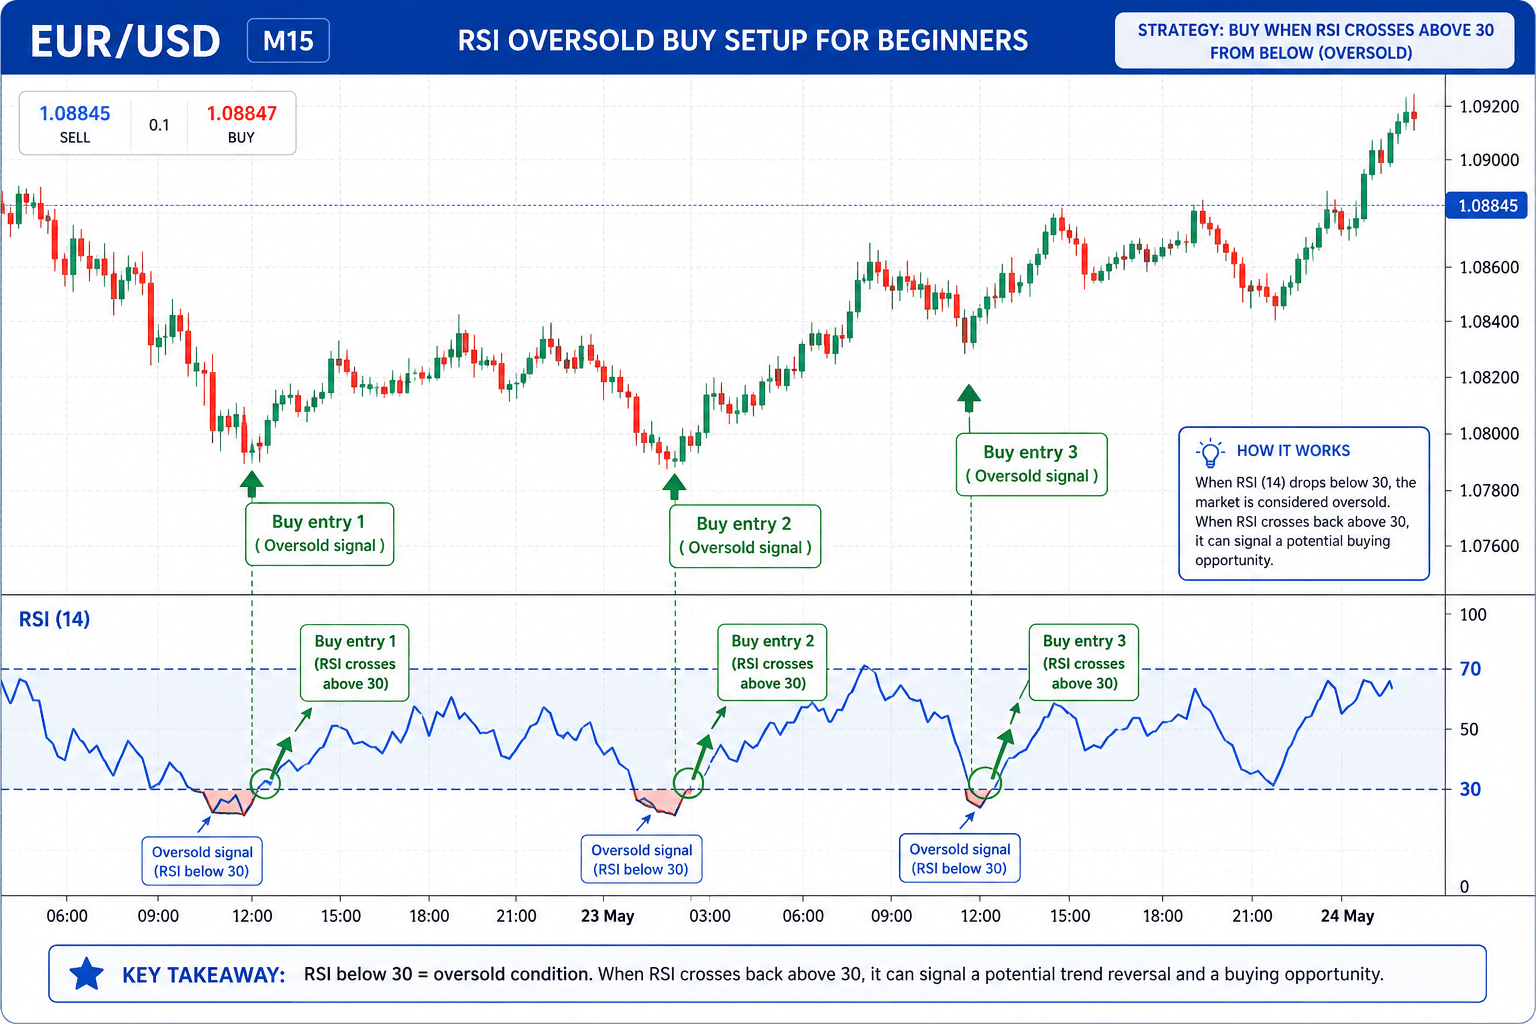
RSI (Relative Strength Index) is one of the most popular technical indicators in trading. It measures the speed and magnitude of price movements and is displayed as an oscillator ranging from 0 to 100. Values above 70 are traditionally considered the overbought zone (price has risen too fast, a pullback is likely), while values below 30 represent the oversold zone (price has fallen too fast, a bounce is possible).
This is one of the simplest trading strategies for beginners precisely because of the clarity of its signals: RSI is either in an extreme zone or it isn’t. There is minimal room for subjective interpretation, making it an excellent starting point for traders learning technical analysis.
Indicator Settings
The standard RSI settings use a period of 14, meaning the calculation is based on the last 14 candles. For short-term trading, some traders use a period of 7 to generate more signals; however, this also increases the number of false triggers. For beginners, the standard period of 14 is recommended as it provides a good balance between signal frequency and reliability.
Entry Rules
Buy signal (CALL / Long): RSI has dropped below the 30 mark (oversold zone) and then begun to reverse back upward, crossing the 30 level from below. This indicates that selling pressure is weakening and buyers are stepping in.
Sell signal (PUT / Short): RSI has risen above 70 (overbought zone) and begun to reverse downward, crossing the 70 mark from above. This signals that buying momentum is fading.
Key point: the signal is not simply RSI entering an extreme zone, but its exit from that zone with a reversal. Opening a trade «against the trend» simply because RSI is above 70 is dangerous — during a strong trend, the indicator can remain in the overbought zone for an extended period. This is one of the most common mistakes beginners make with the RSI strategy.
Trade Example
EUR/USD, timeframe M15. RSI(14) drops to 24 (deep in the oversold zone) and begins to reverse. The candle on which RSI crosses the 30 mark from below closes as bullish (green). We open a buy position with a 15-minute time horizon. Additionally, we check the overall context: if the H1 chart shows an uptrend, the signal becomes even more reliable — we’re trading with the larger trend, not against it.
Combining RSI with Other Tools
RSI is particularly effective when combined with support levels. If RSI shows oversold conditions precisely when the price is at a support level, this creates a double confirmation signal that significantly increases reliability. This combination — RSI oversold + price at support — is one of the most popular and effective setups in technical analysis for beginners.
Strategy 4: Pin Bar (Price Action Trading)
| Difficulty Level | Medium |
| Timeframe | M30, H1 |
| Recommended Assets | Any highly liquid assets |
| Trade Duration | 30–60 minutes |
Strategy Overview
Price action is a trading method based exclusively on analyzing price movement without using indicators. Among beginners, the pin bar pattern is especially popular — it is one of the most reliable reversal signals in technical analysis and has been used by professional traders for decades.
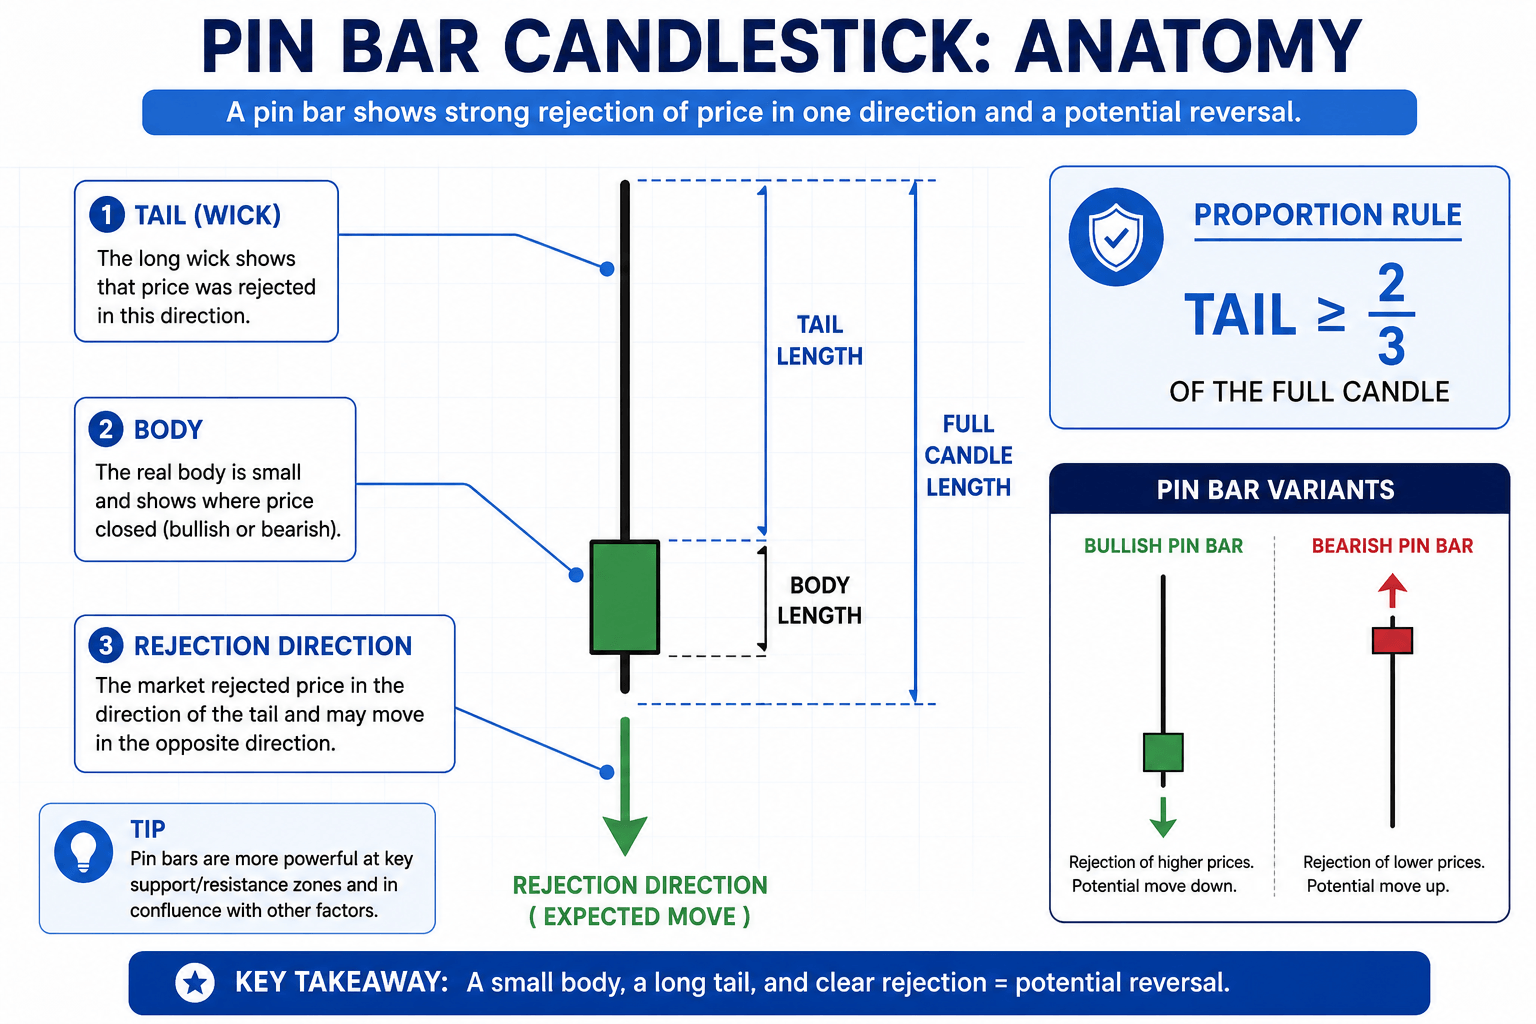
A pin bar (or «pinocchio bar») is a candle with a long tail (shadow or wick) and a small body. The long tail means that the price moved sharply in one direction but was then rejected by the market and returned to its starting point. This is a visual representation of the battle between buyers and sellers, in which one side achieved a convincing victory. Learning to identify pin bars is a foundational skill in price action trading.
Characteristics of a Classic Pin Bar
The tail length should be at least two-thirds of the total candle length (body plus all shadows). The candle body is small and positioned at one end of the range. The tail «points» in the direction of rejection: a bullish pin bar has a long lower tail (price was rejected from below, indicating buyer strength), while a bearish pin bar has a long upper tail (price was rejected from above, indicating seller dominance).
Entry Rules
Bullish pin bar (Buy / Long): a candle with a long lower tail has formed at a support level or at the bottom of a trend. The candle body and its close are in the upper half of the range. This signals that sellers attempted to push the price down but were overwhelmed by buyers — a strong reversal signal.
Bearish pin bar (Sell / Short): the mirror situation — a long upper tail forms at a resistance level, indicating that buyers tried to push higher but were rejected by sellers.
Trade Example
GBP/USD, timeframe H1. At the 1.2650 level, which has already served as support twice, a candle with a long lower tail forms: the price dropped to 1.2618 but returned to 1.2652 by the close. The tail comprises more than 70% of the total candle length — a textbook pin bar. We open a buy position with a 60-minute time horizon. If by the next candle the price moves below the pin bar’s low, the setup has been invalidated.
Why Pin Bars Work
A pin bar is a trace left by the actions of large market players. Long tails often appear in areas where institutional participants (banks, hedge funds) place large orders. This is precisely why this pattern has remained relevant for decades despite changes in market structure and the rise of algorithmic trading. Understanding pin bars gives beginners access to the same price action signals that professional traders rely on.
Strategy 5: News Trading
| Difficulty Level | High (for full implementation) |
| Timeframe | M1, M5 |
| Recommended Assets | Currency pairs linked to the reporting country’s currency |
| Trade Duration | 5–15 minutes |
Strategy Overview
Economic news exerts a powerful short-term impact on financial markets. The release of inflation data, employment figures, GDP reports, or a central bank interest rate decision can move a currency pair’s price by 50–100 pips within minutes. The news trading strategy is built on capturing this impulse and riding the momentum that follows major economic releases.
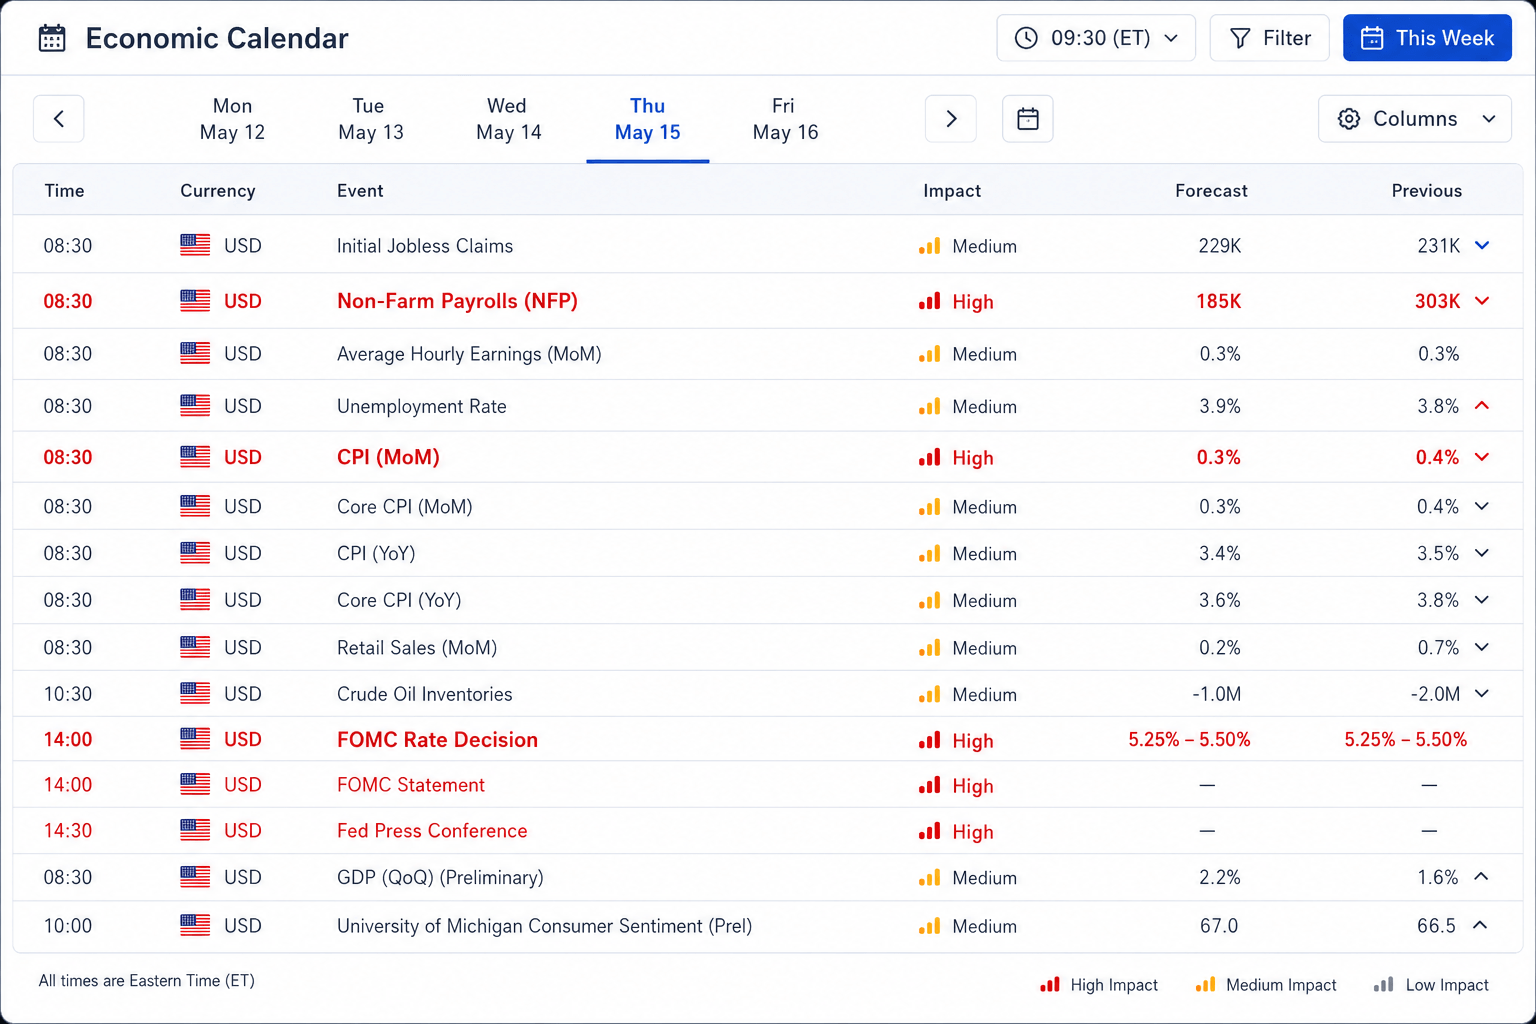
For this strategy, an economic calendar is essential — a tool that lists all scheduled economic events with their publication time, forecast value, and previous value. Such calendars are available for free on Investing.com, Forex Factory, and Bloomberg, and are indispensable tools for any trader who wants to avoid being caught off guard by market-moving events.
News Categories by Impact
High impact events include: US labor market data (NonFarm Payrolls, unemployment rate), consumer price indices (CPI, PCE), Federal Reserve, ECB, and Bank of England interest rate decisions, GDP data for major economies, and US retail sales. Medium impact events include manufacturing PMI data, trade balance figures, and housing market data. For short-term trading, high-impact news is the most interesting — these events produce the clearest and most tradeable price impulses.
Two Approaches to News Trading
First approach — trading after the release. Data is published, the market begins moving in a specific direction. You open a trade in the direction of that movement, expecting the impulse to continue. This is the safer approach for beginners and the one we recommend starting with.
Second approach — trading before the release. The trader analyzes the forecast, compares it with the previous value, and bets on the direction of movement before the data comes out. This is a riskier option: if the data differs from expectations, a loss is virtually guaranteed. This approach requires significant experience and is not recommended for beginners.
Trade Example
US NonFarm Payrolls data is released. Forecast: 200,000 new jobs. Actual value: 312,000 (significantly better than forecast). The USD strengthens sharply. We open a sell position on EUR/USD (the euro will fall relative to the strengthening dollar) with a 5–10 minute time horizon. The initial impulse after the release of strong data typically continues for 5–15 minutes before consolidation or reversal begins.
Risks and Special Considerations
News trading is more complex than it appears. Some brokers widen spreads before major data releases or restrict the ability to open trades in the minutes surrounding publication. The market may «spike» in one direction and then sharply reverse — this phenomenon is known as a «stop hunt» or «fake move.» Beginners are recommended to first master technical trading strategies and only then transition to working with news events. Always check your broker’s specific policies regarding trading around news releases.
How to Choose a Trading Strategy for Your Style
There is no single «correct» trading strategy for beginners. The choice depends on several factors that are important to honestly assess before you start trading with real capital.
If you have limited time for market monitoring, choose strategies on higher timeframes (H1 and above) with trade durations of 30 minutes or more. Strategies on M5 require constant screen presence and are more mentally demanding.
If you’re just beginning to learn technical analysis, the RSI strategy will be the simplest starting point: the signal is maximally clear, visually intuitive, and requires only one indicator on your chart.
If you’re willing to invest time in studying price patterns, pin bar trading at key levels produces high-quality signals and scales well as your experience grows. This approach also builds the foundational chart-reading skills that benefit all other strategies.
For those who regularly follow the economic calendar, the news trading strategy can serve as an additional tool — but not as your primary strategy at the beginning stage. News trading requires quick decision-making under pressure, which is a skill that develops with experience.
Universal recommendation: start with one strategy and work only with it for at least 2–4 weeks on a demo account. Attempting to simultaneously learn multiple approaches leads to confusion, inconsistent results, and an inability to evaluate what’s actually working. Master one approach first, then expand your toolkit.
Common Beginner Mistakes When Applying Trading Strategies
Even the most reliable trading strategy doesn’t protect against losses if the trader systematically makes the same mistakes. Here are the most common ones that beginners encounter — and how to avoid them.
Ignoring the bigger picture. Every signal needs to be evaluated in the context of what’s happening on a higher timeframe. A bullish pin bar on M15 in the midst of a strong downtrend on H4 is a weak signal at best. Always trade in the direction of the higher timeframe trend — this single rule will filter out a significant percentage of losing trades.
Too many signals and filters. Many beginners, after reading several articles, try to use five indicators simultaneously, hoping that «the more confirmations, the more reliable the signal.» In reality, this leads to analysis paralysis: there are almost no signals that satisfy all criteria, and those that do appear are entered too late. Start with 1–2 indicators maximum.
Breaking money management rules after a loss. A losing streak of 3–4 consecutive trades is a normal part of any trading system, including profitable ones. Attempting to «recover» by increasing trade size destroys the entire mathematical foundation of the strategy. Keep your position size consistent regardless of recent results.
Trading during low-liquidity hours. Technical patterns work significantly worse in thin markets. Avoid trading during overnight hours (when European and American exchanges are closed) and during the first minutes of a new trading session opening. The best trading hours for most strategies are during the London-New York session overlap (roughly 13:00–17:00 UTC).
Not keeping a trading journal. Without a trading journal, it’s impossible to understand whether a strategy is working or not, which mistakes are recurring, and what improvements are needed. Record every trade: asset, timeframe, reason for entry, result, and your emotional state at the time of the trade. This data becomes invaluable after 50–100 trades.
FAQ: Frequently Asked Questions About Trading Strategies
What is the most profitable trading strategy?
The answer depends on market conditions, the asset, and the time horizon. There is no «best» strategy in absolute terms. Any strategy can be profitable with disciplined application and unprofitable when the trader violates their own rules. Among the five strategies described, trend following and trading from support and resistance levels tend to show the most stable results over time — provided proper signal selection and consistent risk management are maintained.
Do I need paid indicators or signal services to trade these strategies?
No. All five strategies use either basic indicators (moving averages, RSI) built into every trading platform, or require no indicators at all (pin bar, support and resistance levels). Paid indicators and especially paid signal services are unnecessary for a beginner trader — moreover, their use hinders the development of your own understanding of the market. Focus on mastering free tools before considering any paid additions.
How long should I test a strategy on a demo account?
The minimum period for obtaining a statistically significant sample is 50–100 trades. This is approximately 3–6 weeks with moderate trading frequency. If the statistics over this period show a winning trade percentage above 55–58%, the strategy is mathematically viable under standard market conditions. Don’t rush to live trading — the demo phase is where you build the habits that will sustain your performance with real money.
Do these strategies work on ultra-short timeframes (60-second trades)?
Extremely unreliably. On ultra-short timeframes, market noise is so high that technical patterns essentially stop working. None of the methods described is designed for trades shorter than 5 minutes. Ultra-short trading is closer to gambling than systematic trading and is not recommended — especially for beginners who are still developing their analytical skills.
Can I combine multiple strategies from this list?
Yes, but sequentially, not simultaneously. A sensible approach: master one strategy to the point of stable results on a demo account, then add a second as a supplementary tool for different market conditions. For example, the trend following strategy works well in trending conditions, while the support and resistance strategy performs better in range-bound markets. Together, they cover the majority of market situations you’ll encounter.
Do I need to study fundamental analysis for these trading strategies?
For Strategies 1–4, basic technical analysis knowledge is sufficient. However, understanding the fundamental context helps avoid trading against a strong macroeconomic impulse. The minimum every trader should know: when major news events are scheduled for your traded assets, and avoiding opening trades during those periods unless you are specifically using the news trading strategy. A quick daily check of the economic calendar takes less than a minute and can save you from significant unnecessary losses.
What is the best trading strategy for a complete beginner?
The RSI strategy (Strategy 3) is typically the easiest starting point for complete beginners because the signals are visually clear and require minimal interpretation. Once you’re comfortable reading RSI signals, consider adding support and resistance level analysis (Strategy 2) to create a powerful combination. The progression from RSI → levels → pin bars → trend following → news trading represents a natural learning path from simple to more complex approaches.
Conclusion
Successful trading requires a systematic approach. The five strategies described in this guide — trend following, trading from support and resistance levels, RSI-based trading, pin bar price action, and news trading — give a beginner trader a sufficient toolkit to start their journey in the financial markets.
None of them is a «magic formula» for guaranteed profits. Each strategy requires practice, understanding of market context, and discipline in risk management. It is precisely the combination of a working trading system with proper money management that determines results over the long run.
Start with a demo account. Choose one strategy. Trade it consistently, keep records, analyze your mistakes. This is the only path from beginner to a trader who works with the market in a stable, sustainable way.
This material is educational in nature and does not constitute investment advice. Trading financial instruments involves a high risk of loss of invested funds.
You Might Also Like
Multiple Timeframe Analysis Strategy: Complete Guide for 2026
Table of Contents Why Single Timeframe Analysis Is Structurally Incomplete The Three-Tier Timeframe Framework Understanding Each Tier's Role The Analytical...

AtlantTrade Review 2026: Payouts, Platform & Features
AtlantTrade is a trading platform focused on currency pairs, cryptocurrencies, commodities, and stock indices. It combines a relatively accessible entry...
Support and Resistance Strategy
Table of Contents Why Support and Resistance Is the Foundation of All Technical Analysis What Support and Resistance Actually Represent...