




Table of Contents
- What Is the RSI Indicator?
- How RSI Works — the Formula Explained Simply
- How to Read the RSI Panel
- RSI Trading Signals — What to Look For
- RSI Divergence — the Most Powerful Signal
- RSI Settings — Which Period to Use
- RSI Mistakes Traders Make
- RSI Combined With Other Indicators
- RSI Limitations — What It Cannot Do
- FAQ
What Is the RSI Indicator?
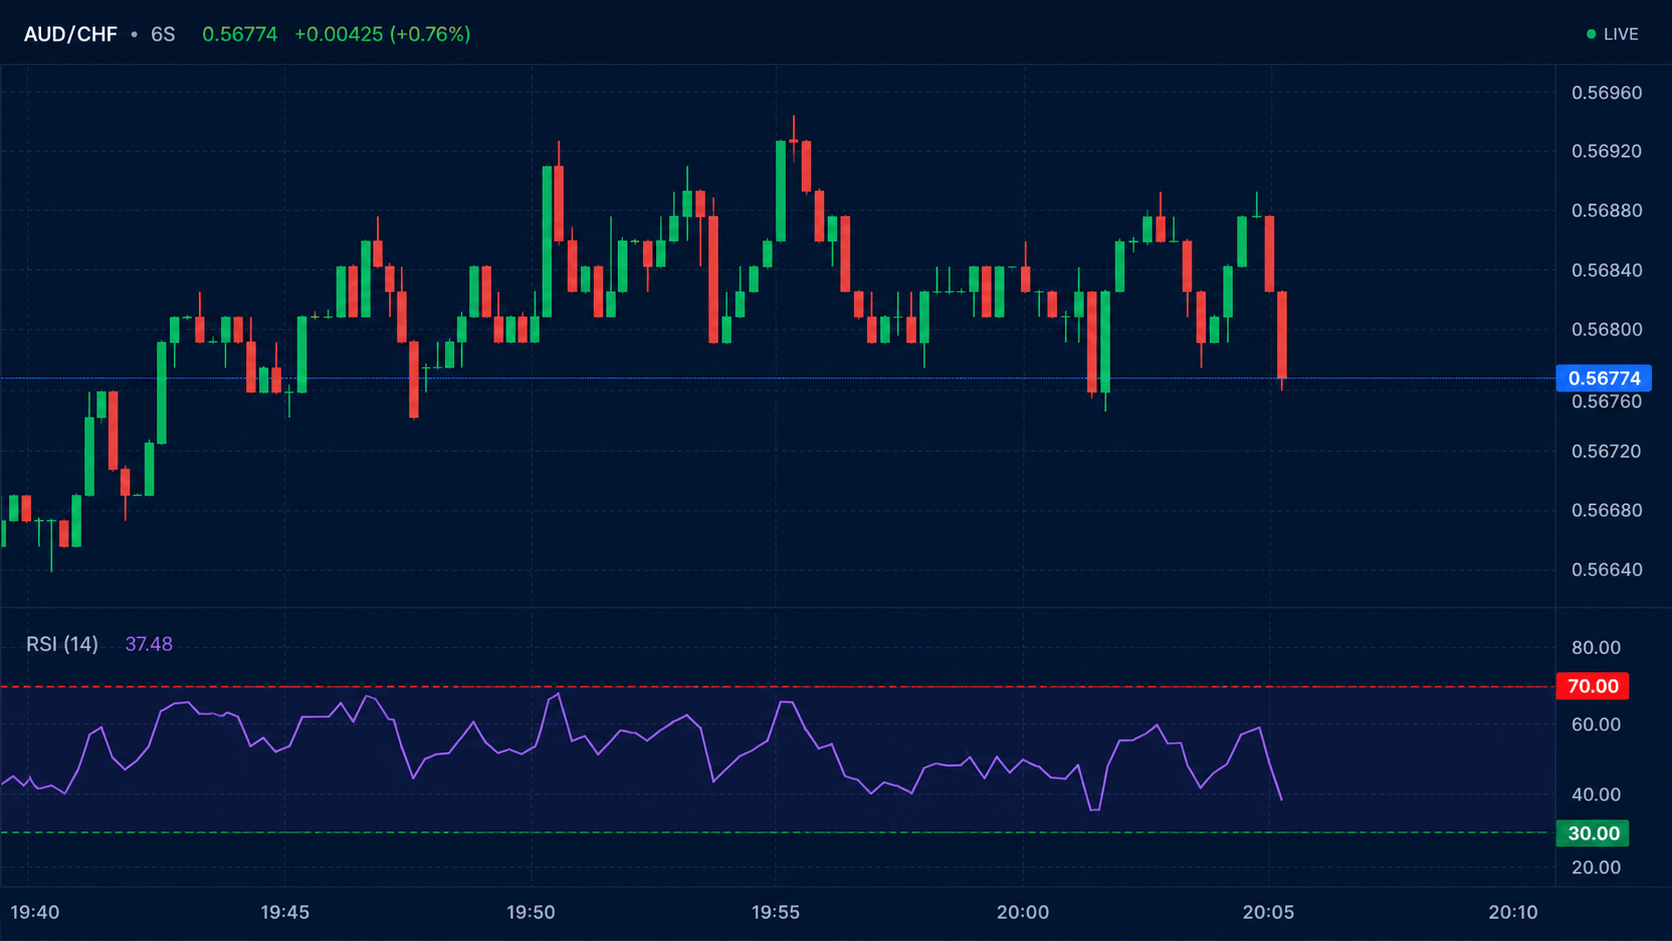
The RSI — Relative Strength Index — is a momentum oscillator that measures the speed and magnitude of recent price changes to assess whether an asset is overbought or oversold. It was developed by J. Welles Wilder Jr. and introduced in his 1978 book New Concepts in Technical Trading Systems.
RSI is displayed as a line that moves between 0 and 100 in a separate panel below the price chart. It is one of the most widely used technical indicators across all markets — forex, stocks, indices, and commodities — and is available on virtually every trading platform.
Why traders use RSI:
- To identify potential reversal points when price has moved too far too fast
- To confirm the direction of an existing trend
- To spot divergence between price and momentum
- To generate entry and exit signals in rule-based trading approaches
RSI does not predict price direction with certainty. No indicator does. It measures a specific characteristic of past price movement — relative momentum — and generates signals that must be evaluated in the context of the broader chart and market conditions.
How RSI Works — the Formula Explained Simply
RSI compares the average size of recent up-moves to the average size of recent down-moves over a defined period, then scales the result between 0 and 100.
The standard period is 14 — meaning RSI looks at the last 14 candles (or 14 bars, depending on your timeframe).
The simplified logic:
- If price has closed higher on most of the last 14 candles: RSI is high (above 50, possibly above 70)
- If price has closed lower on most of the last 14 candles: RSI is low (below 50, possibly below 30)
- If up-moves and down-moves are roughly balanced: RSI is near 50
You do not need to calculate RSI manually. Every trading platform calculates and displays it automatically. What matters is understanding what the resulting number means — not the arithmetic behind it.
How to Read the RSI Panel
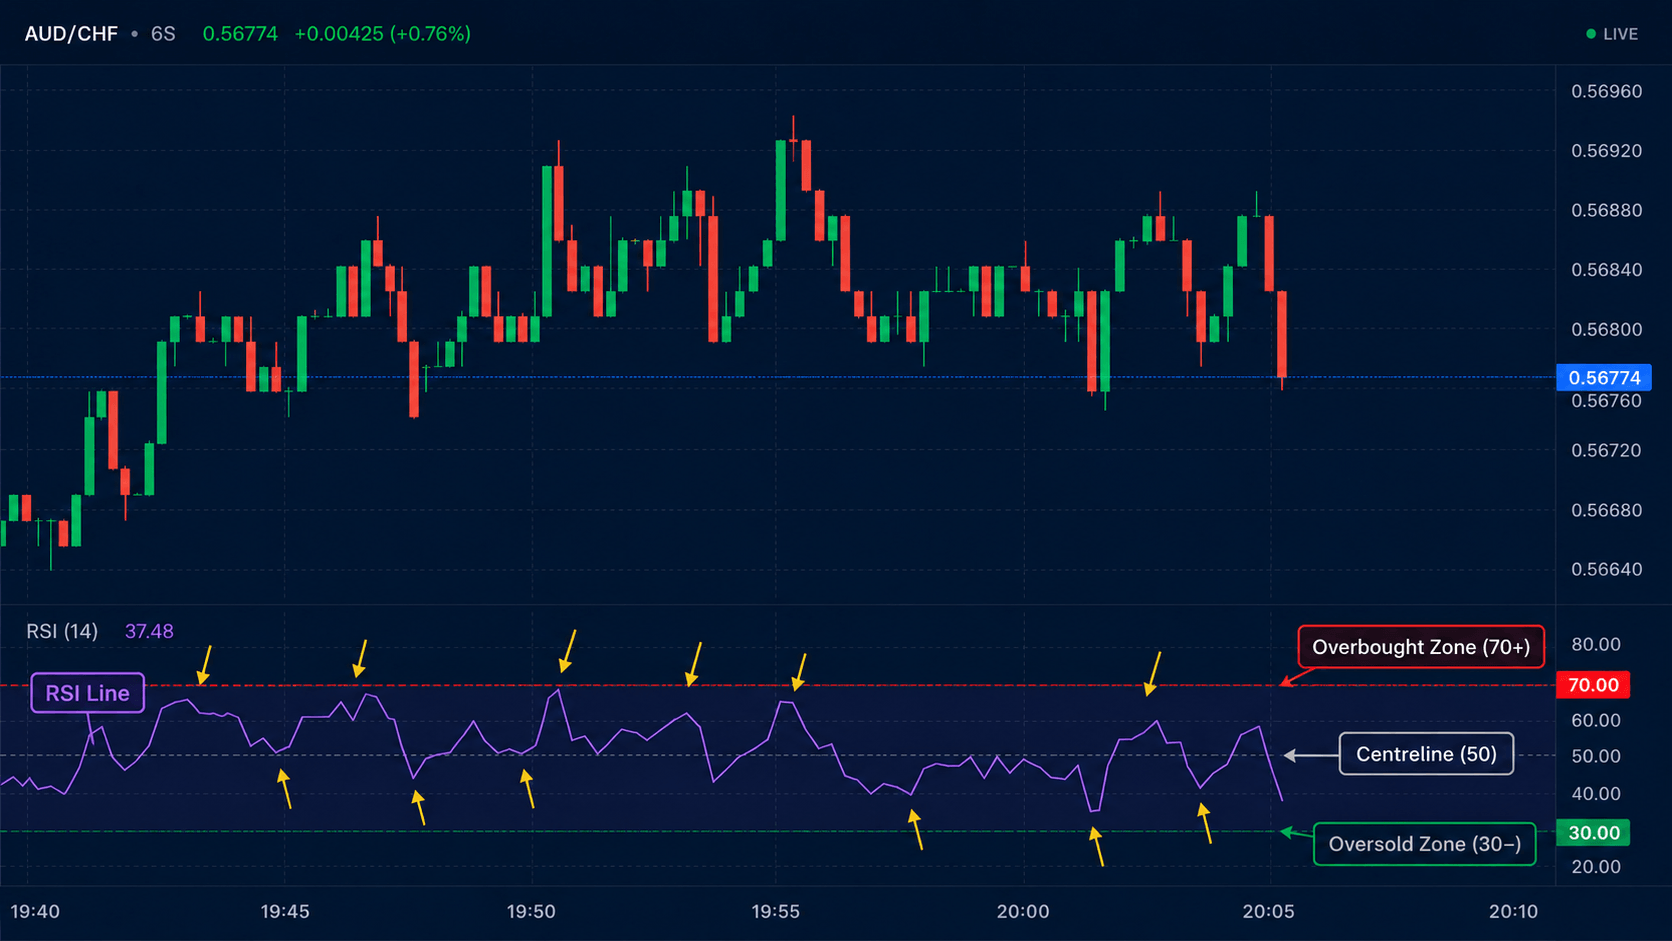
The RSI appears as a line oscillating between 0 and 100 in a panel below your price chart. Three horizontal reference lines are standard:
70 — Overbought level
When RSI crosses above 70, it suggests that recent upward momentum has been unusually strong. Price may be overextended. Traders watch for RSI to turn back below 70 as a potential signal that momentum is weakening.
50 — Centreline
The 50 level acts as a dividing line between bullish and bearish momentum. RSI consistently above 50 indicates that up-moves are outpacing down-moves — bullish momentum. RSI consistently below 50 indicates bearish momentum. The 50 level is particularly useful for trend confirmation.
30 — Oversold level
When RSI drops below 30, it suggests recent downward momentum has been unusually strong. Price may be oversold. Traders watch for RSI to turn back above 30 as a potential signal that selling pressure is easing.
Important clarification on «overbought» and «oversold»:
These terms describe momentum, not an obligation for price to reverse. In a strong trend, RSI can remain in overbought territory (above 70) for extended periods without price reversing. RSI above 70 in isolation is not a sell signal. Context matters.
RSI Trading Signals — What to Look For
Signal 1: Overbought/Oversold Crossback
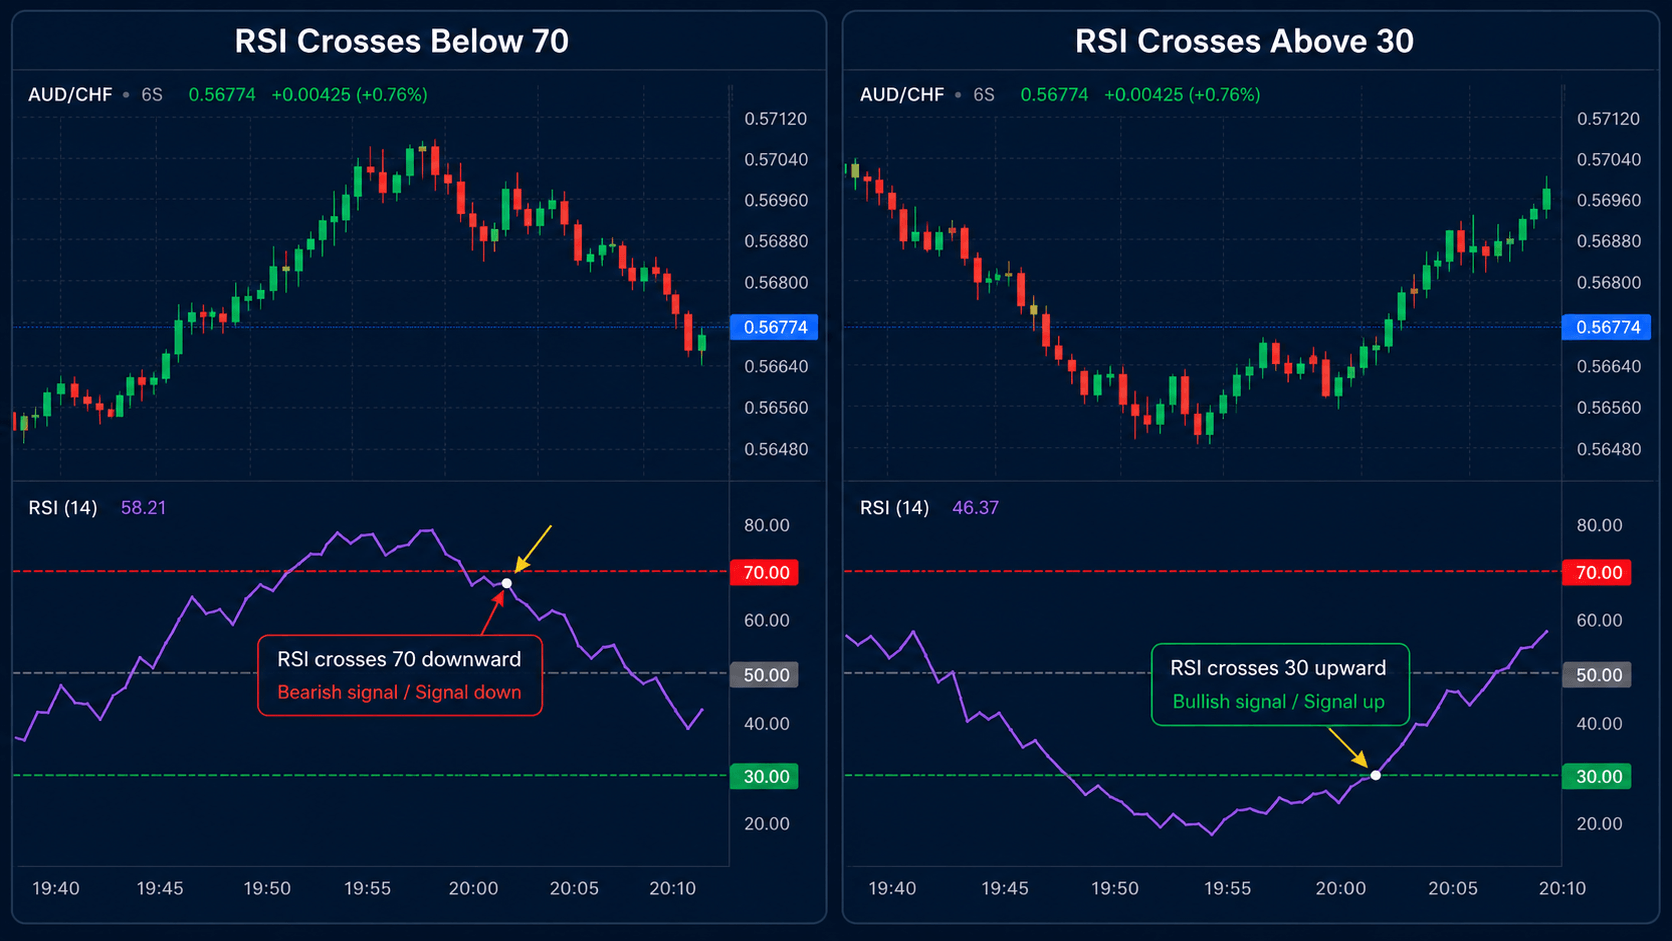
The most commonly taught RSI signal is the crossback — when RSI moves into the overbought or oversold zone and then crosses back:
- RSI rises above 70, then crosses back below 70 → potential bearish signal
- RSI drops below 30, then crosses back above 30 → potential bullish signal
Why the crossback matters more than the level itself:
Entering a trade simply because RSI is above 70 can result in entering against a strong trend. Waiting for RSI to cross back below 70 adds confirmation that momentum has actually turned.
Signal 2: Centreline Cross
- RSI crosses above 50: bullish momentum building, trend may be shifting upward
- RSI crosses below 50: bearish momentum building, trend may be shifting downward
The centreline cross is more useful for trend-following approaches than for reversal signals.
Signal 3: Failure Swings
A failure swing occurs when RSI reaches extreme levels but fails to reach the same extreme on the next swing — signalling a potential momentum shift:
Bullish failure swing: RSI drops below 30, bounces above 30, pulls back but stays above 30, then breaks above the previous bounce high.
Bearish failure swing: RSI rises above 70, drops below 70, rallies but fails to reach 70 again, then breaks below the previous dip.
Failure swings are Wilder’s original application of RSI and are often more reliable than simple overbought/oversold signals.
RSI Divergence — the Most Powerful Signal
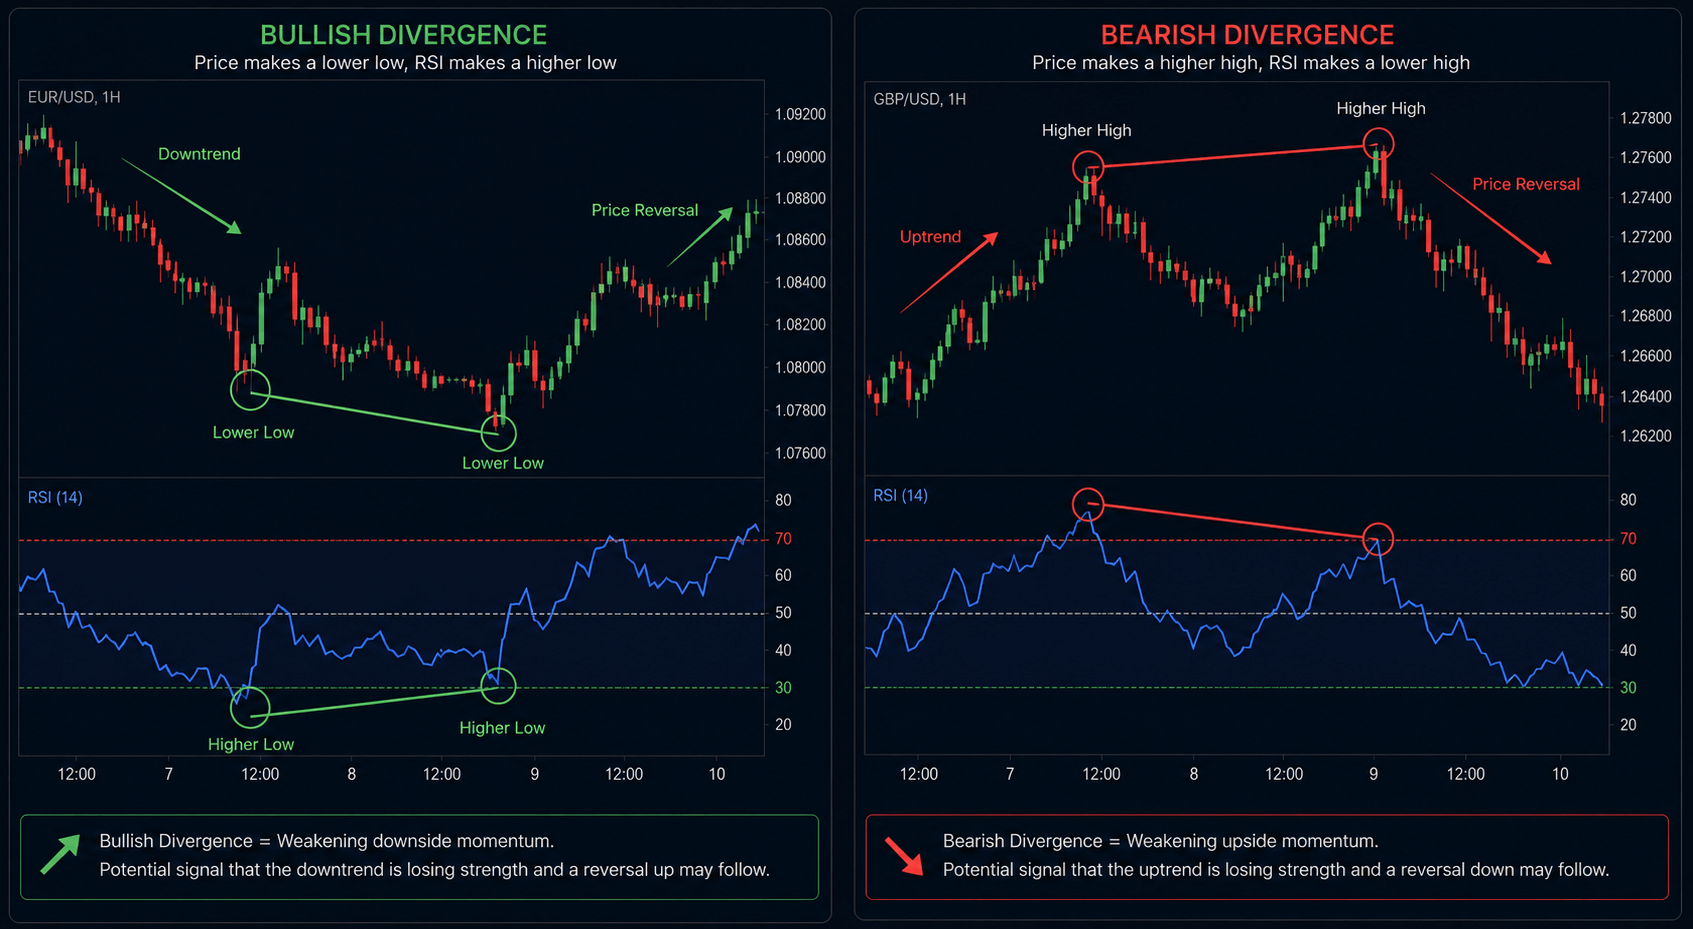
RSI divergence occurs when price and RSI are moving in different directions. It suggests that momentum is not confirming the price trend — often a warning sign of an impending reversal.
Bullish Divergence
What it looks like: Price makes a new lower low, but RSI makes a higher low (RSI does not confirm the new low in price).
What it suggests: Selling pressure is declining even though price is still falling. Momentum is diverging from direction — a potential reversal signal.
Bearish Divergence
What it looks like: Price makes a new higher high, but RSI makes a lower high (RSI does not confirm the new high in price).
What it suggests: Buying pressure is declining even though price is still rising. Momentum is weakening — a potential reversal signal.
Important limitations of divergence:
- Divergence can persist for multiple candles before price reverses — or not reverse at all
- Divergence is most reliable at significant chart levels (support, resistance, key highs/lows)
- Do not trade divergence in isolation — use it alongside other confirmation tools
RSI Settings — Which Period to Use
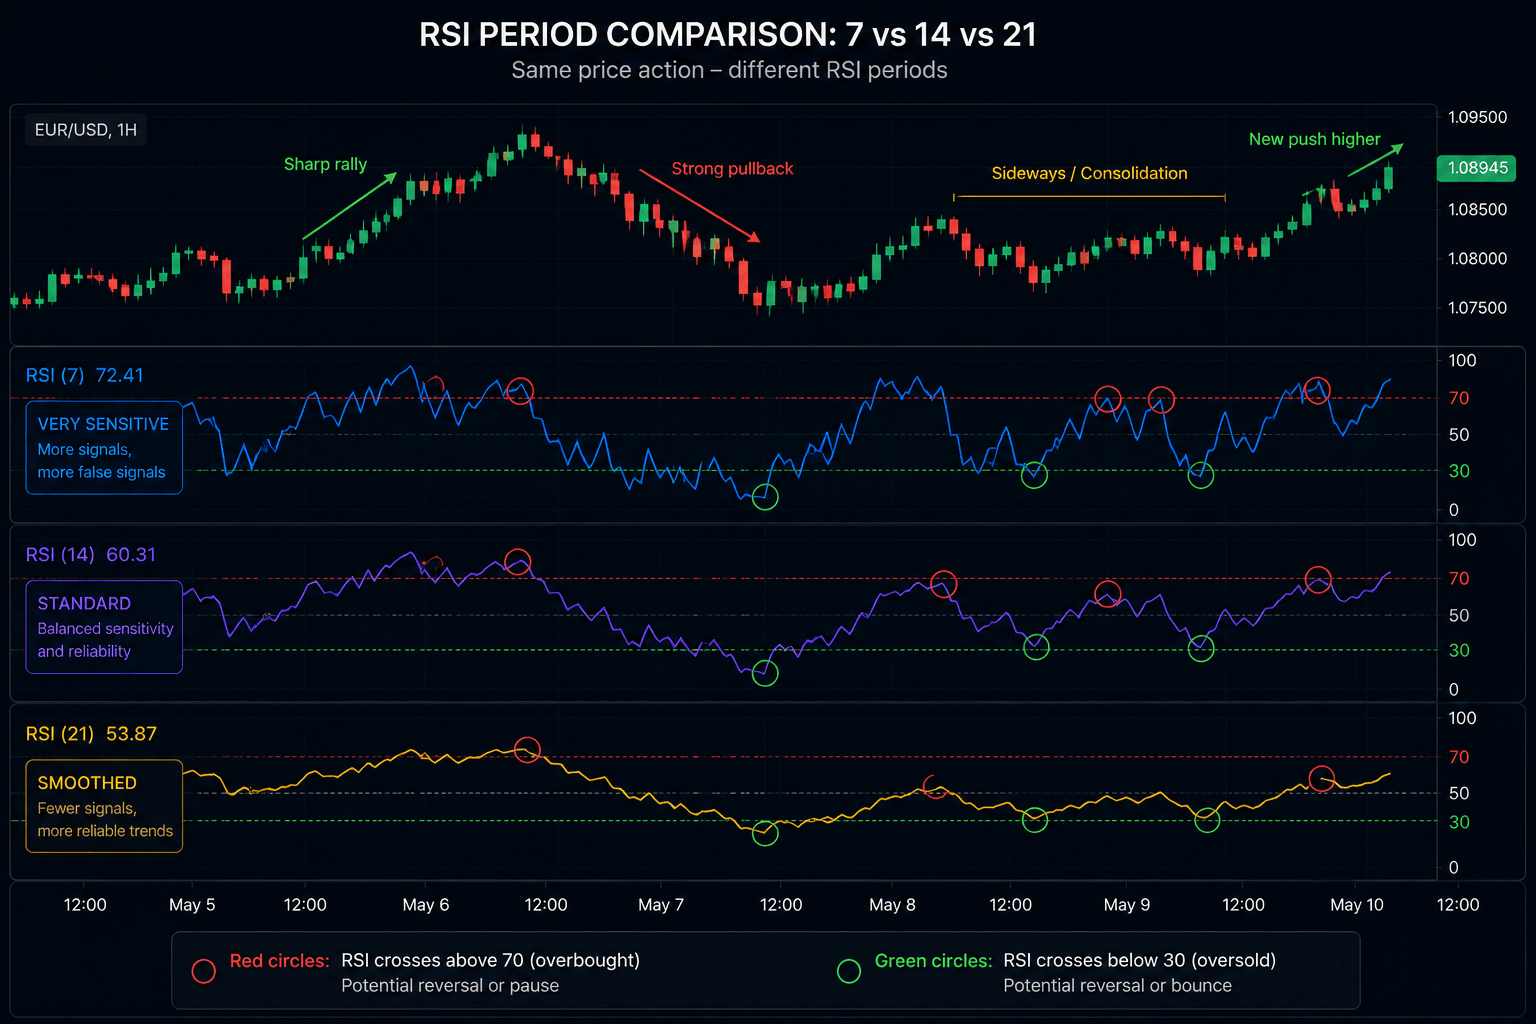
The default RSI period is 14, and for most traders and timeframes this is the appropriate starting point. However, different periods produce different characteristics:
| RSI Period | Characteristics | Best suited for |
|---|---|---|
| 7 | Very sensitive — many signals, more false signals | Very short timeframes, experienced traders |
| 14 | Standard — balanced sensitivity and smoothness | Most timeframes, most traders |
| 21 | Smoother — fewer signals, stronger when they occur | Longer timeframes, trend confirmation |
| 25+ | Very smooth — primarily for trend direction | Swing trading, macro trend analysis |
The levels also change with period:
Some traders adjust overbought/oversold levels based on the period and market:
- For period 7: consider 80/20 instead of 70/30 (to reduce false signals in a volatile period)
- For period 21: standard 70/30 remains appropriate
Recommended starting point: Use RSI 14 with standard 70/30 levels. Change period only after establishing whether the standard settings fail to produce useful signals on your specific timeframe and market — and with a clear reason for the change, not just experimentation.
Top Broker Picks for 2026
Three platforms that ranked highest in our real-account testing this year.



RSI Mistakes Traders Make
Mistake 1: Selling every time RSI hits 70
RSI above 70 during a strong uptrend can remain above 70 for many candles. Shorting every time RSI reaches 70 in a bullish trend means fighting the trend — a consistently expensive approach.
The fix: Look for the crossback below 70 and combine with other signals (price action, resistance level, candlestick pattern).
Mistake 2: Using RSI as a standalone strategy
RSI is a momentum indicator. It does not incorporate price structure, volume, news events, or support/resistance. Decisions made purely on RSI readings without chart context will be incomplete.
The fix: Use RSI to add momentum context to price-based analysis — not to replace it.
Mistake 3: Ignoring the trend direction
An oversold RSI reading (below 30) in a downtrend is normal. Price can continue lower for many sessions after RSI shows «oversold.» Using RSI oversold as a buy signal against the primary trend is one of the most common ways traders lose capital on technically sound-looking trades.
The fix: Define the trend direction first. On uptrend: look for oversold RSI as a buy signal. On downtrend: look for overbought RSI as a sell signal. Trade with the trend, not against it.
Mistake 4: Changing RSI settings too frequently
Adjusting the period until you find settings that would have worked on past data is an example of curve-fitting — optimising for historical results rather than genuine forward-looking signal quality.
The fix: Choose your RSI settings based on a principle (timeframe, market type, your trading style) and test consistently over a meaningful sample before changing.
RSI Combined With Other Indicators
RSI works better as part of a broader analytical approach than in isolation. Common and well-reasoned combinations:
RSI + Moving Average
Use a moving average to define trend direction. RSI to time entries within that trend. Example: only take RSI oversold signals when price is above the 50-period EMA (confirming uptrend).
RSI + Support and Resistance
The most reliable RSI signals occur at meaningful price levels. An RSI divergence at a key resistance level is more significant than RSI divergence in open space.
RSI + Volume (where available)
An RSI overbought signal accompanied by declining volume suggests weakening momentum — stronger signal than RSI alone.
RSI + MACD
RSI for immediate momentum, MACD for trend confirmation. When both give the same directional signal, the confluence adds confidence. See our MACD Guide → for how these two indicators interact.
RSI Limitations — What It Cannot Do
- RSI cannot predict magnitude. It suggests momentum direction, not how far price will move.
- RSI lags price. It is calculated from past price data. By the time RSI gives a signal, some of the move has already occurred.
- RSI produces false signals in ranging markets. In a sideways market, RSI oscillates frequently between overbought and oversold without producing meaningful directional moves.
- RSI does not account for fundamentals. A news event can invalidate any RSI signal instantly.
- No indicator is consistently profitable in isolation. RSI is a tool for analysis — its value depends entirely on how it is applied within a broader decision framework.
FAQ
What does RSI stand for?
RSI stands for Relative Strength Index. It is a momentum oscillator developed by J. Welles Wilder Jr., introduced in 1978, that measures the speed and magnitude of recent price changes on a scale of 0 to 100.
What is a good RSI level to buy?
There is no universally «good» RSI level to buy. RSI below 30 (oversold) is a commonly watched level, but it signals momentum, not a guaranteed reversal. In a downtrend, RSI can remain below 30 for extended periods. A more complete approach looks for RSI crossing back above 30 (the crossback), combined with a support level or bullish price pattern, before considering an entry.
What RSI setting is best?
The standard RSI 14 period is the most widely used and a sound default for most traders and timeframes. Shorter periods (7, 9) produce more signals but more false positives. Longer periods (21, 25) produce fewer but generally stronger signals. The best setting is the one that aligns with your timeframe and trading approach — determined by testing, not by changing until the chart looks right in hindsight.
Is RSI reliable?
RSI is a widely respected momentum indicator with a solid mathematical foundation. Whether it is «reliable» depends entirely on how it is used. RSI in isolation, without trend context, price structure, and risk management, produces unreliable results. RSI as one input within a broader analytical approach can add meaningful information. No indicator has consistent standalone reliability.
What is RSI divergence?
RSI divergence occurs when the direction of RSI movement and the direction of price movement disagree. Bullish divergence: price makes a new lower low, RSI makes a higher low. Bearish divergence: price makes a new higher high, RSI makes a lower high. Divergence suggests that price movement is not confirmed by momentum — a potential signal that the current move is weakening.
Can RSI be used on any timeframe?
Yes. RSI can be applied to any timeframe — from 1-minute charts to monthly charts. The interpretation principles remain the same. On shorter timeframes, RSI signals are more frequent and more prone to false signals (noise). On longer timeframes, signals are fewer but generally more significant.
You Might Also Like

What Is Volatility in Trading?
Volatility measures the degree to which an asset's price fluctuates over a given period. High volatility means price is making...

What Is a Turnover Requirement in Binary Options?
A turnover requirement (also called wagering requirement or volume condition) is the total amount of trading volume you must generate...

Stochastic Oscillator Guide 2026: How to Read Signals
Table of Contents What Is the Stochastic Oscillator? How the Stochastic Oscillator Works Reading the Stochastic Panel — %K and...