




Table of Contents
- What Is a Moving Average?
- Simple Moving Average (SMA) — How It Works
- Exponential Moving Average (EMA) — How It Differs
- EMA vs SMA — Which to Use and When
- How to Use Moving Averages to Identify Trends
- Moving Average as Dynamic Support and Resistance
- Moving Average Crossover Signals
- Which Moving Average Period to Use
- Common Moving Average Mistakes
- FAQ
What Is a Moving Average?
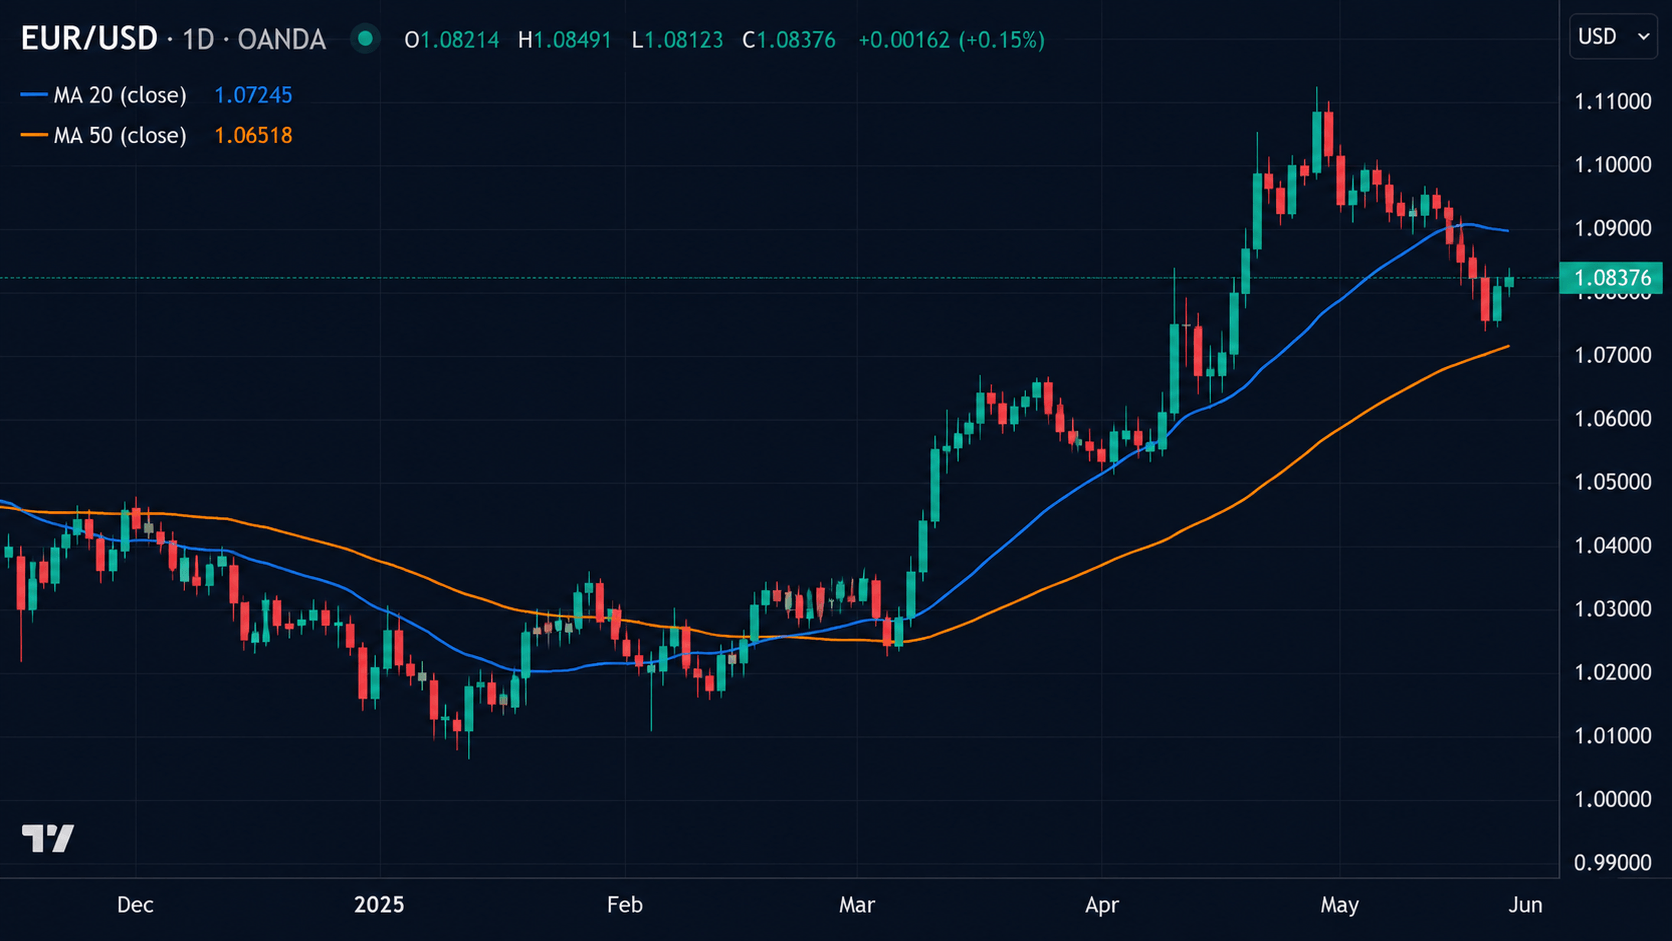
A moving average (MA) is a line plotted on a price chart that represents the average price of an asset over a defined number of past periods. As each new candle closes, the average updates — «moving» forward with price.
Moving averages serve two primary purposes:
Trend identification: The direction a moving average is pointing (upward, downward, flat) indicates the direction of the underlying trend over that time period.
Signal generation: When price interacts with a moving average, or when two moving averages cross each other, these events can signal potential entry or exit points.
Moving averages are lagging indicators — they reflect past price data, not future price. They smooth out noise and make the trend more visible, but they will always lag the actual price turns.
Simple Moving Average (SMA) — How It Works
The SMA calculates the arithmetic mean of price over the defined period. Each period is weighted equally.
For a 10-period SMA: add the closing prices of the last 10 candles and divide by 10. When the next candle closes, drop the oldest price and add the newest — the average «moves.»
Characteristics of SMA:
- Slower to react to recent price changes
- Smoother line — less noise
- All periods weighted equally — a close from 20 periods ago has the same weight as the most recent close
Best used for: Long-term trend identification, support and resistance on higher timeframes, Golden Cross / Death Cross signals.
Exponential Moving Average (EMA) — How It Differs
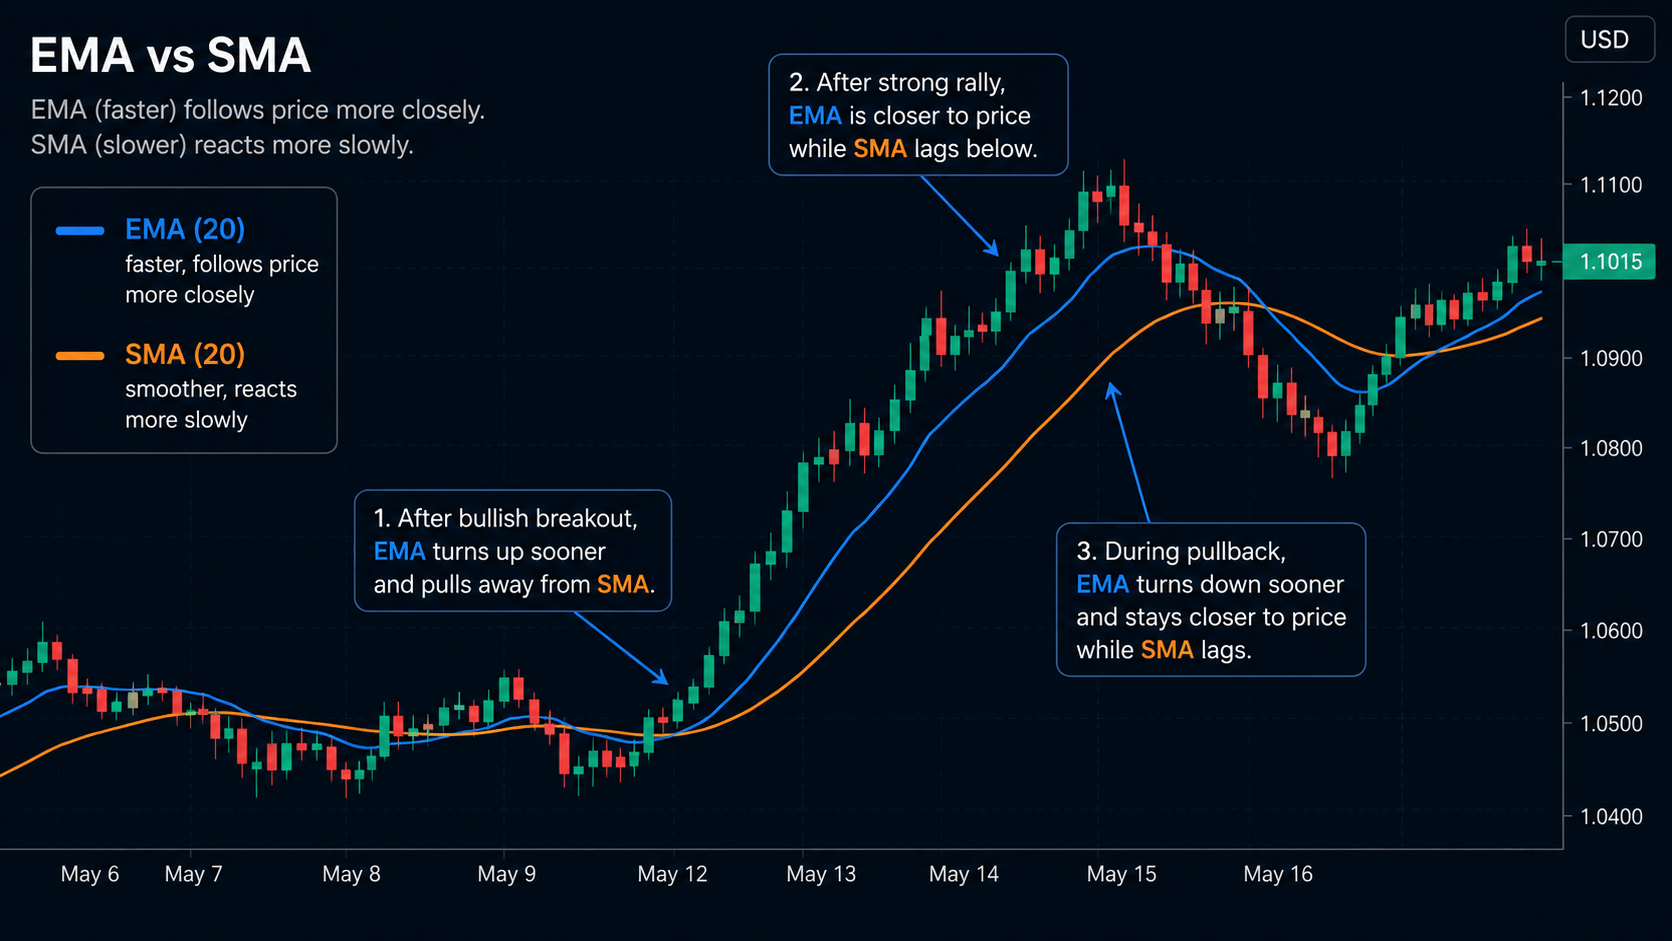
The EMA gives more weight to recent prices than older ones. The exact weighting depends on the period — a shorter period EMA gives more weight to the most recent prices.
Characteristics of EMA:
- Faster to react to recent price changes
- More sensitive — follows price more closely
- Recent prices carry more influence than older ones
Best used for: Shorter timeframes, dynamic support and resistance in active trends, MACD calculation (MACD is built from two EMAs).
EMA vs SMA — Which to Use and When
| SMA | EMA | |
|---|---|---|
| Responsiveness | Slower | Faster |
| Smoothness | Smoother | More reactive |
| False signals | Fewer but later | More but earlier |
| Best for | Trend identification, higher timeframes | Entries, shorter timeframes, dynamic S/R |
| Common periods | 50, 100, 200 | 9, 20, 50, 200 |
Which to choose: There is no universally superior choice. EMA is generally preferred for shorter timeframe trading because its faster reaction makes it more immediately relevant to current price action. SMA is preferred for long-term trend context (the 200 SMA is the most widely watched long-term trend indicator globally) because its slower reaction makes it more stable.
Many traders use both: a faster EMA for timing entries, a slower SMA for trend direction context.
How to Use Moving Averages to Identify Trends
A moving average’s direction is the simplest trend identification tool available:
- MA pointing upward, price above MA: Uptrend
- MA pointing downward, price below MA: Downtrend
- MA flat, price oscillating around it: Ranging, no clear trend
Multiple timeframe moving average analysis:
Use a longer MA (e.g., 200 EMA) for overall trend direction and a shorter MA (e.g., 20 EMA) for entry timing:
- Long-term MA pointing up + short-term MA pulling back to it → potential pullback entry in uptrend
- Long-term MA pointing down + short-term MA rallying to it → potential pullback entry in downtrend
This approach aligns trades with the larger trend while timing entries at lower-risk points within that trend.
Moving Average as Dynamic Support and Resistance
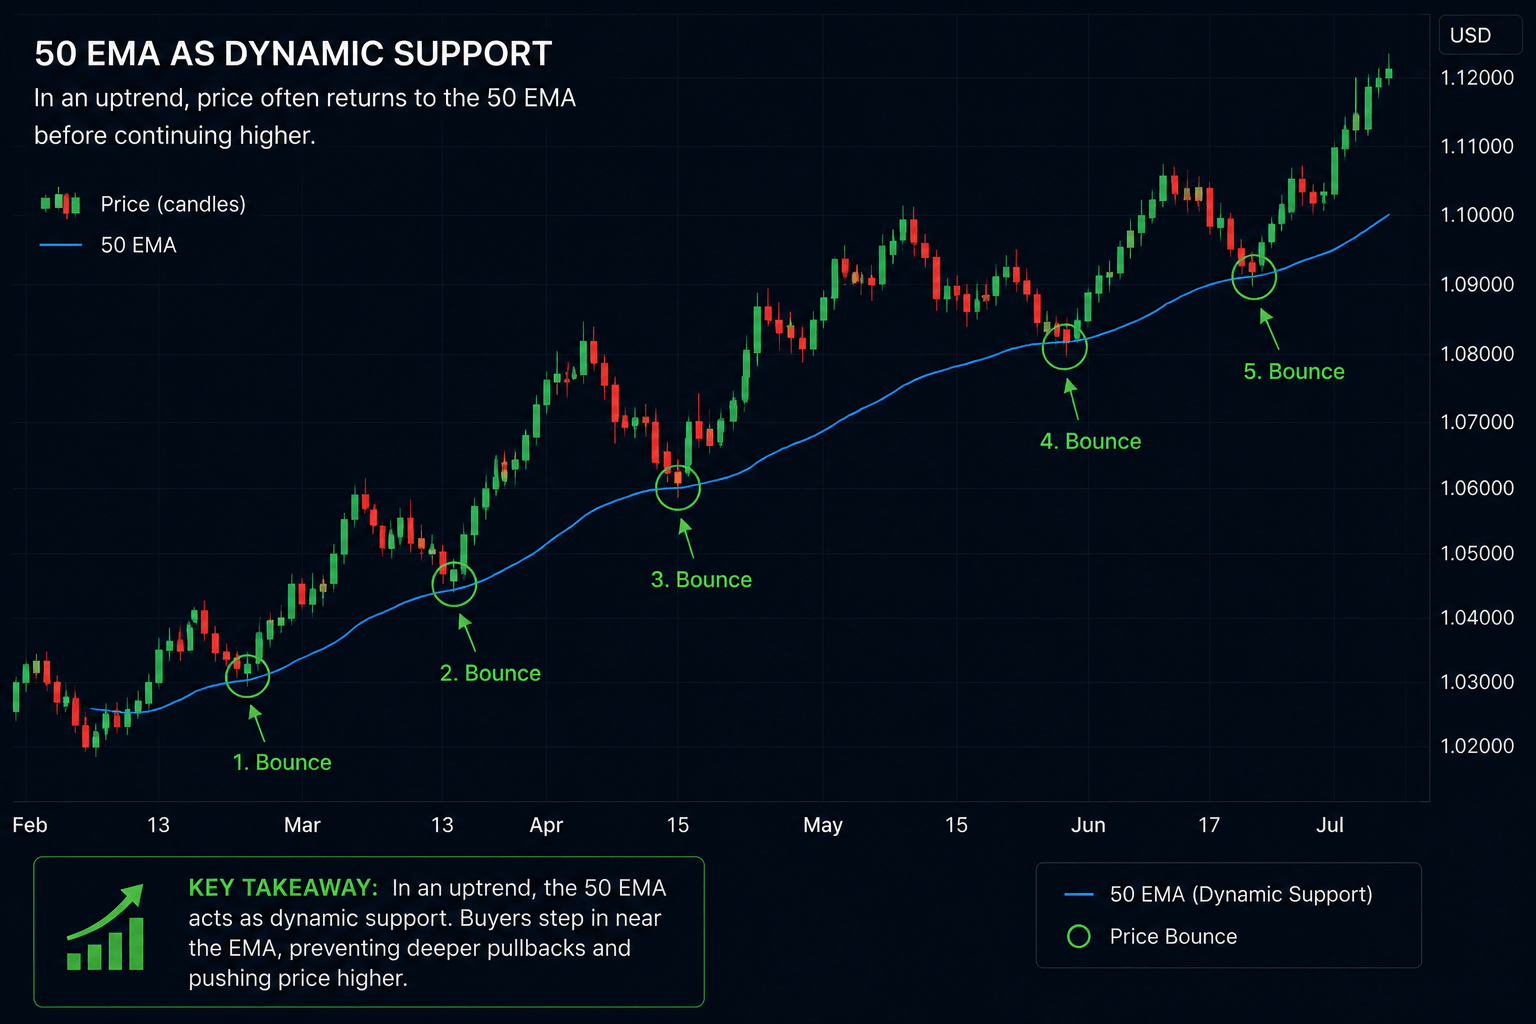
In an active trend, price frequently returns to test a moving average before continuing in the trend direction. This makes the MA act as a dynamic (moving) support or resistance level.
In an uptrend: The 20 EMA or 50 EMA often acts as dynamic support — price pulls back to the MA and bounces.
In a downtrend: The same MA often acts as dynamic resistance — price rallies to the MA and reverses.
The most significant dynamic support/resistance MAs are those watched by the most traders:
- 20 EMA: Popular for short-term traders and swing traders
- 50 EMA/SMA: Widely watched across institutional and retail trading
- 200 EMA/SMA: The most significant long-term moving average — watched globally
When price tests a widely watched MA (especially the 50 or 200) from a trend direction, the signal carries more weight because many participants are watching the same level.
Top Broker Picks for 2026
Three platforms that ranked highest in our real-account testing this year.



Moving Average Crossover Signals
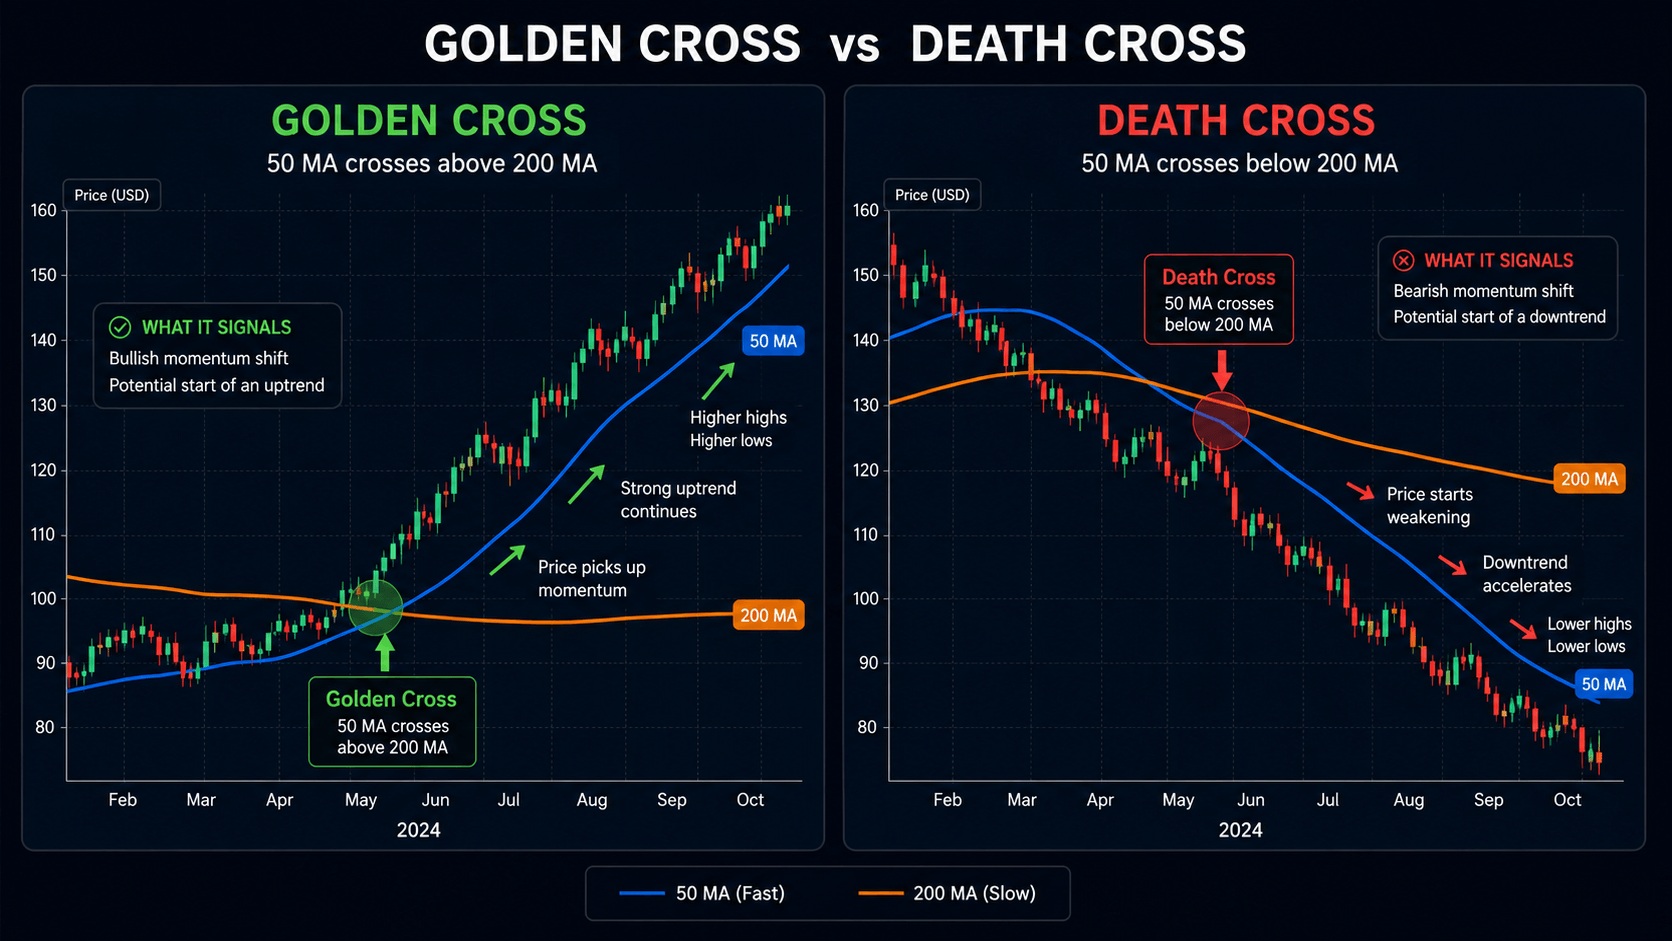
When a shorter-period MA crosses a longer-period MA, it signals a potential change in momentum or trend.
Golden Cross
Definition: A shorter MA (typically 50-period) crosses above a longer MA (typically 200-period).
Signal: Bullish — short-term momentum is shifting above long-term trend.
Significance: The 50/200 Golden Cross is one of the most widely referenced signals in financial markets.
Death Cross
Definition: A shorter MA (typically 50-period) crosses below a longer MA (typically 200-period).
Signal: Bearish — short-term momentum is falling below long-term trend.
Important context on crossover signals:
- Crossovers lag the actual trend change — by the time the crossover occurs, the move has already begun
- In ranging markets, crossovers produce frequent and unreliable signals
- The 50/200 crossover (Golden/Death Cross) is most significant on daily or weekly charts
Which Moving Average Period to Use
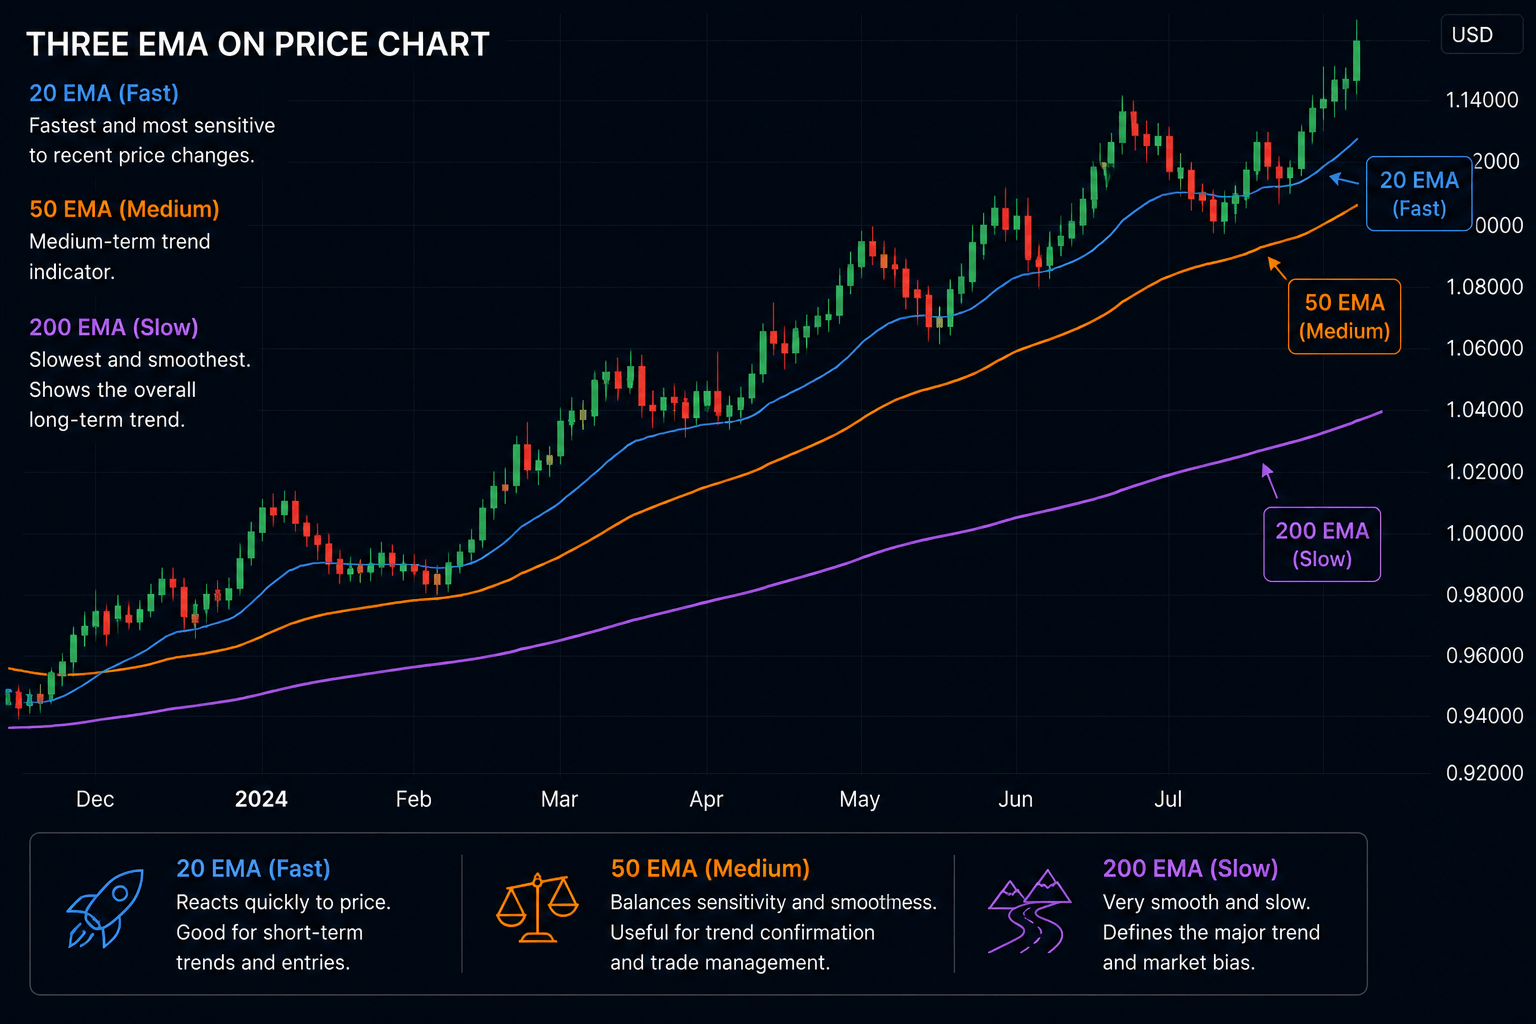
| Period | Type | Common application |
|---|---|---|
| 9 EMA | Fast | Very short-term momentum, intraday |
| 20 EMA | Fast-medium | Short-term trend, swing trading entries |
| 50 EMA/SMA | Medium | Medium-term trend, widely watched dynamic S/R |
| 100 SMA | Medium-long | Trend context, institutional reference |
| 200 EMA/SMA | Long-term | Primary trend direction — most significant |
Starting recommendation: Add the 20 EMA and 200 EMA to your chart. The 20 EMA shows short-term price flow; the 200 EMA shows overall trend direction. When these agree — 20 EMA rising and price above 200 EMA — the trend context is bullish. When they disagree, the market is in a transition phase.
Common Moving Average Mistakes
Mistake: Using too many moving averages
Adding 5–7 MAs to a chart creates visual clutter and makes every crossover look like a signal. Use 2–3 at most.
Mistake: Treating MA crossovers as precise entry signals
MA crossovers identify momentum shifts, not precise entry points. Using a crossover for exact timing without confirmation from price action leads to late entries.
Mistake: Applying a short-term MA on a long-term chart expecting precision
A 5 EMA on a daily chart will cross price repeatedly and provide little directional clarity. Match the MA period to your trading timeframe.
Mistake: Expecting MAs to work in ranging markets
In sideways price action, MAs flatten out and crossovers produce noise. Trend-following tools — including MAs — work best when there is a trend to follow.
FAQ
What is the most important moving average?
The 200-period SMA or EMA is the most widely watched moving average globally. It is used by institutional traders, funds, and retail participants to assess long-term trend direction. Price above the 200 MA is broadly considered a bullish context; below it, bearish.
Is EMA better than SMA?
Not universally. EMA reacts faster to recent price changes, making it more useful for shorter timeframes and active trend trading. SMA is smoother and more stable, making it more useful for long-term trend identification. Many traders use both together.
What is a Golden Cross?
A Golden Cross occurs when a shorter moving average (usually the 50-period) crosses above a longer moving average (usually the 200-period). It is a bullish signal indicating that short-term momentum has risen above long-term trend. The opposite — the 50-period crossing below the 200-period — is called a Death Cross.
What moving average should beginners start with?
Start with two: the 20 EMA for short-term trend direction and the 50 EMA for medium-term context. Add the 200 EMA or SMA once you are comfortable with how the shorter MAs behave. Keep your chart simple.
Do moving averages work on short timeframes?
Yes, but shorter timeframes produce more noise and more false signals. A moving average that works clearly on a daily chart will generate many more crossovers — and more false signals — on a 5-minute chart. The principles are the same; the signal quality varies with timeframe.
You Might Also Like

What Is Volatility in Trading?
Volatility measures the degree to which an asset's price fluctuates over a given period. High volatility means price is making...

What Is a Turnover Requirement in Binary Options?
A turnover requirement (also called wagering requirement or volume condition) is the total amount of trading volume you must generate...

Stochastic Oscillator Guide 2026: How to Read Signals
Table of Contents What Is the Stochastic Oscillator? How the Stochastic Oscillator Works Reading the Stochastic Panel — %K and...